
SLIDE 1
1/22/19 1
2018 Spills & Incidents Report
Nelli Vanderburg
Prince William Sound Regional Citizens’ Advisory Council
January 2019
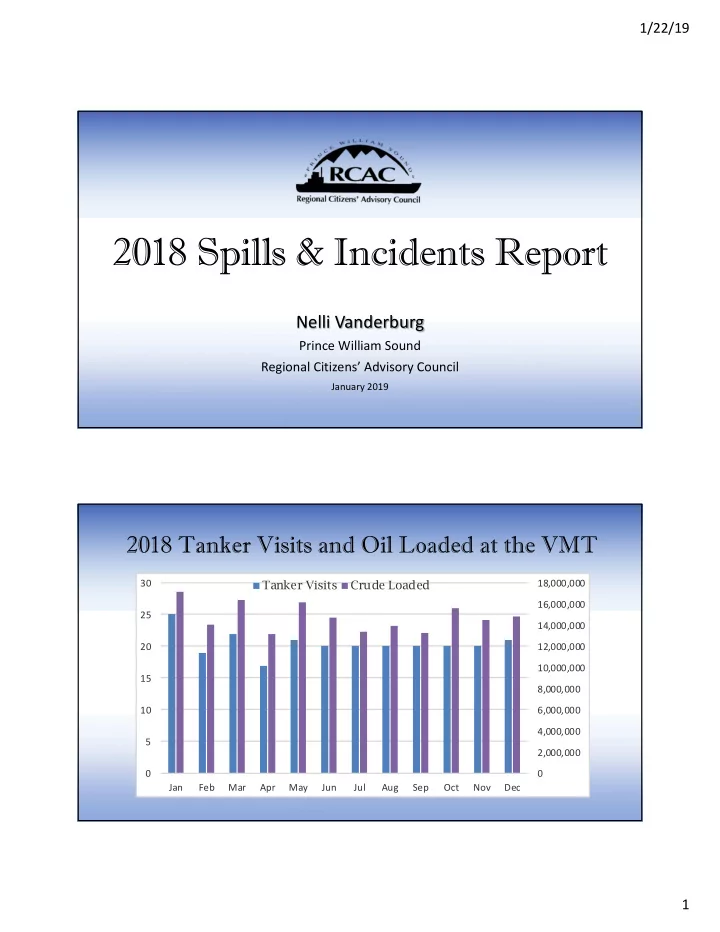
2018 Tanker Visits and Oil Loaded at the VMT
2,000,000 4,000,000 6,000,000 8,000,000 10,000,000 12,000,000 14,000,000 16,000,000 18,000,000 5 10 15 20 25 30 Jan Feb Mar Apr May Jun Jul Aug Sep Oct Nov Dec
Tanker Visits Crude Loaded