
SLIDE 1
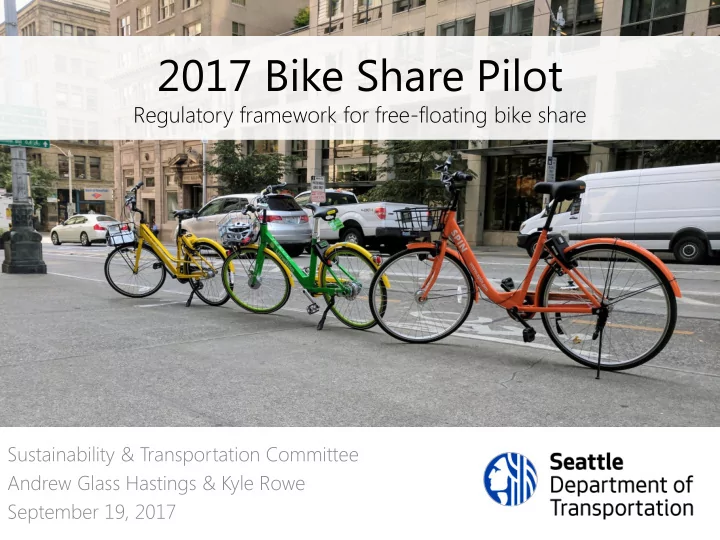
2017 Bike Share Pilot
Regulatory framework for free-floating bike share
Sustainability & Transportation Committee Andrew Glass Hastings & Kyle Rowe September 19, 2017
2017 Bike Share Pilot Regulatory framework for free-floating bike - - PowerPoint PPT Presentation
2017 Bike Share Pilot Regulatory framework for free-floating bike share Sustainability & Transportation Committee Andrew Glass Hastings & Kyle Rowe September 19, 2017 Our mission, vision, and core values Mission : deliver a high-quality
Regulatory framework for free-floating bike share
Sustainability & Transportation Committee Andrew Glass Hastings & Kyle Rowe September 19, 2017
Committed to 5 core values to create a city that is:
For all
2
3
4
5
6
7
8
9
10
11
12
13
14
15
16
17
18
19
21
22
24
25
26
27
28
29
30
31
32
Image credit: silent hill/imaginechina
40
3134 5008 1000 2000 3000 4000 5000 6000 Rides
Pronto week 1 vs Spin week 1
Pronto Spin
41
4704 5008 1000 2000 3000 4000 5000 6000 Rides
Pronto best week vs Spin week 1
Pronto Spin
42
1.7 3.2 0.5 1 1.5 2 2.5 3 3.5 Rides
Pronto best vs pilot best
Pronto Pilot
43
0.7 2.1 0.5 1 1.5 2 2.5 3 3.5 Rides
Pronto avg vs pilot avg
Pronto Pilot