2016 17 distance educatjon actjvity
play

2016 - 17 Distance Educatjon Actjvity Courses are offered through - PDF document

2016 - 17 Distance Educatjon Actjvity Courses are offered through Distance Education (DE) at all three By definition, distance education refers to colleges in the Kern Community College District Bakersfield College instruction in which


  1. 2016 - 17 Distance Educatjon Actjvity Courses are offered through Distance Education (DE) at all three By definition, distance education refers to colleges in the Kern Community College District – Bakersfield College instruction in which distance separates (BC), Cerro Coso Community College (CC), and Porterville College (PC). the instructor and student, and interaction The following information describes distance education activity for the occurs through the assistance of 2016 - 17 academic year along with comparisons to previous years. communication technology. How many students participate in Distance Education courses? Across the three - year time period studied, the number of students enrolled in at least one DE course increased at all three colleges. BC (+42.2%), PC (+31.7%), and CC (+7.0%) each experienced growth in DE participants over this time period. In 2016 - 17, 27.4% of all BC students, 69.0% of all CC students, and 35.1% of all PC students enrolled in at least one DE course. A smaller percentage of students at each college only enrolled in DE courses during the 2016 - 17 academic year: 5.8% at BC, 52.5% at CC, and 8.6% at PC. Note: In the table above, students were counted just once regardless of the number of DE courses enrolled in during the academic year (also known as “ headcount ” ). Students were only included if they were still enrolled on census day. When evaluating if students only enrolled in DE, only coursework at the specific college is evaluated - some students may be attending traditional courses at other colleges, in or out of district. Do students taking Distance Education differ from traditional students? The tables above show the demographic distributions for DE and traditional students in the 2016 - 17 academic year. Compared to traditional students, DE students are more likely to be Female than Male at all three colleges with the largest difference at CC. DE students are less likely to be 19 or younger and are more likely to be 20 - 39 years old than traditional students. At both BC and PC, DE students are more likely to be White and less likely to be Hispanic compared to traditional students; the reverse is the case at CC. These patterns echo the overall demographic distributions from recent years. KCCD Instjtutjonal Research and Reportjng 1 July 2017
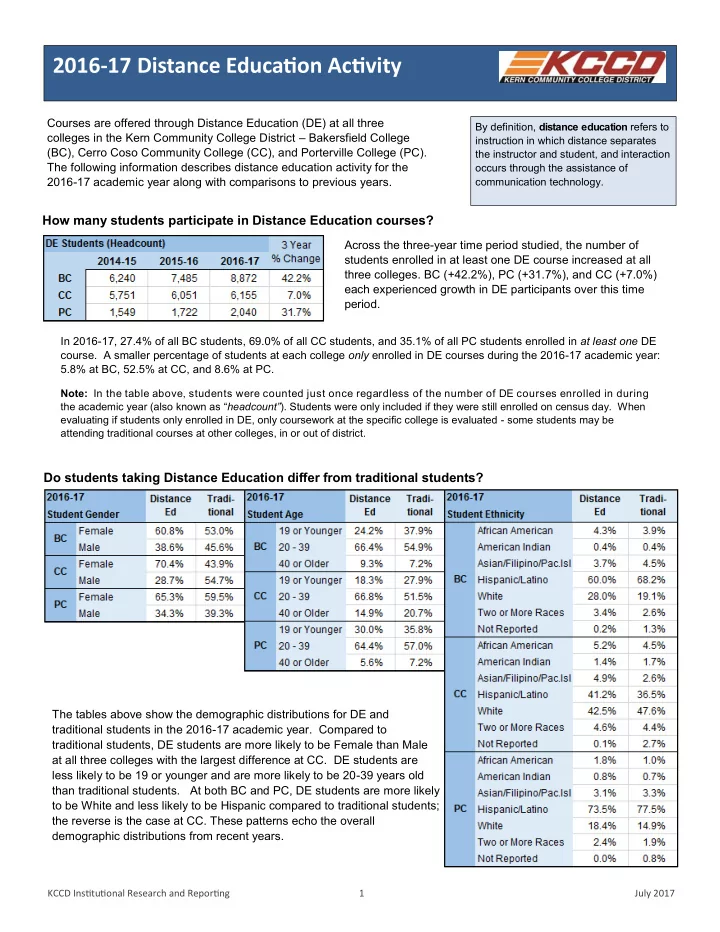
  2. How many courses are offered via Distance Education? The number of distinct courses offered via DE has increased at all three colleges, with the largest percentage increase at PC (+60.6%). In 2016 - 17, 10.7% of all BC courses, 63.0% of all CC courses and 19.9% of all PC courses were offered via DE. These rates are similar to prior years for BC and CC, and higher for PC in 2016 - 17 compared to previous years. Note: In the table above, each course is counted only once, regardless of the number of sections offered. How many sections are offered via Distance Education? The number of sections offered via DE increased at all three colleges, with the biggest percentage increase at BC (+61.8%). In 2016 - 17, 7.7% of all BC sections, 44.6% of all CC sections, and 13.3% of all PC sections were offered via DE. Note: An individual course may be offered multiple times in different sections. These sections are offered during different days of the week, different times of the day, by different instructors and through different modes of instruction such as distance education. The table above describes the total number of individual sections taught through DE. How many Distance Education enrollments are there? The number of DE enrollments increased at all three colleges over the studied time frame, with the biggest percentage increase at BC (+49.6%). In 2016 - 17, 11.7% of all BC enrollments, 56.4% of all CC enrollments and 14.5% of all PC enrollments were in DE sections. Note: Individual students may take multiple sections during a term and/or year. These are referred to as student enrollments. The table above describes the number of enrollments students have taken via Distance Education. How many FTES (full - time equivalent students) are generated via Distance Education sections? The number of FTES generated via DE increased at all three colleges, with PC experiencing the greatest increase (+37.7%) followed closely by BC (+37.4%). In 2016 - 17, 10.3% of all BC FTES, 53.7% of all CC FTES and 11.4% of all PC FTES were generated through DE enrollments. KCCD Instjtutjonal Research and Reportjng 2 July 2017

  3. Does the attrition rate between 1st Day and term - end differ for Distance Education sections? The attrition rate for DE sections is considerably higher than that of traditional sections for all three colleges. Across the three - year period, both DE and traditional attrition rates declined at all three colleges. The attrition gap between DE vs. traditional sections has declined for each college. CC shows the largest DE vs. traditional attrition gaps, while BC shows the smallest. Note: The attrition rate depicted in the table to the left is a simple rate based on the number of students enrolled at term - end vs. the number enrolled at first day, and is included to illustrate the higher rate of drops in DE sections. This rate differs from a retention rate, which is calculated using individual grade records. What is the retention rate for DE sections? How does it differ from traditional sections? The retention rate for DE sections is lower than that of traditional sections by about 4 to 9 percentage points. For both DE and traditional sections, retention rates have increased for all three colleges across the studied time frame. Additionally, retention gaps between DE and traditional sections have closed slightly for each college. Note: The retention rates in the table to the right are based upon student grades. The calculation equals the sum of all A, B, C, D, F, I, P, and NP grades divided by the sum of all A, B, C, D, F, I, P, NP, and W grades. The ‘ Gap ’ is the percentage point difference between DE and Traditional retention rates. What is the success rate for DE sections? How does it differ from traditional sections? The success rate for DE sections is lower than that of traditional sections, by about 5 to 17 percentage points. Across the three - year period, both DE and traditional success rates have trended upward. The success gap has increased slightly at CC, where traditional success rates have improved more than DE rates. We see the opposite at BC and PC, where the success gap has closed as DE success rates improved more than traditional success rates. For comparison purposes, the 2016 - 17 statewide DE Success rate was 66.4%, up from 64.7% in 2015 - 16. Note: The success rates depicted in the table to the left are based on student grades. The calculation equals the sum of all A, B, C, and P grades divided by the sum of all A, B, C, D, F, I, P, NP, and W grades. The ‘ Gap ’ is the percentage point difference between DE and Traditional success rates. KCCD Instjtutjonal Research and Reportjng 3 July 2017

Download Presentation
Download Policy: The content available on the website is offered to you 'AS IS' for your personal information and use only. It cannot be commercialized, licensed, or distributed on other websites without prior consent from the author. To download a presentation, simply click this link. If you encounter any difficulties during the download process, it's possible that the publisher has removed the file from their server.

Recommend


More recommend