
SLIDE 1
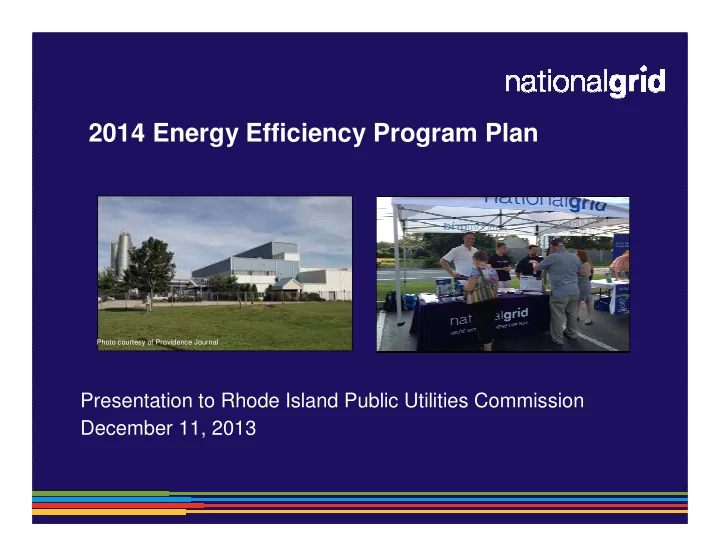
2014 Energy Efficiency Program Plan
Presentation to Rhode Island Public Utilities Commission December 11, 2013
Photo courtesy of Providence Journal
2014 Energy Efficiency Program Plan Photo courtesy of Providence - - PowerPoint PPT Presentation
2014 Energy Efficiency Program Plan Photo courtesy of Providence Journal Presentation to Rhode Island Public Utilities Commission December 11, 2013 Presentation Overview Focus on our customers 2014 Plan Considerations Residential
Photo courtesy of Providence Journal
2
3
4
Electric Savings (Annual MWh)
50,000 100,000 150,000 200,000 250,000 300,000 2003 2004 2005 2006 2007 2008 2009 2010 2011 2012 2013 2014 MWh
Gas Savings (Annual MMBtu)
50,000 100,000 150,000 200,000 250,000 300,000 350,000 2008 2009 2010 2011 2012 2013 2014 MMBtu
6
7
8
50,000 100,000 150,000 200,000 250,000 300,000 2013 2014 2015 (Proposed)
MWh
0.00% 0.65% 1.29% 1.94% 2.58% 3.23% 3.87%
% of Sales
CHP Core Programs 3-yr-plan Trajectory
9
100,000 150,000 200,000 250,000 300,000 350,000 400,000 450,000 2013 2014 2015 2016 Filed Revised w/ cuts Revised Trajectory Filed Trajectory
Small Business (<200 kW) Retrofit Large Customers (>200 kW) Retrofit Large Customers (all Usage size) New Construction
Informational technical Operational financial
70% of project cost 30% financing Up to 50% of “project Cost” Up to 75% of “Incremental Cost”
18
25
27
28
29
30
31
32
33
34
35
36
37
38
39
40
41 41
42 42
43