SLIDE 4 4
7
50,000 100,000 150,000 200,000 250,000 300,000 350,000 2001 2002 2003 2004 2005
New customers and cold drink equipment driving product availability
15% increase in active customers in 2005 19% increase in cold drink coolers in 2005
Cold drink coolers Active customers
100,000 200,000 300,000 400,000 500,000 600,000 700,000 2001 2002 2003 2004 2005
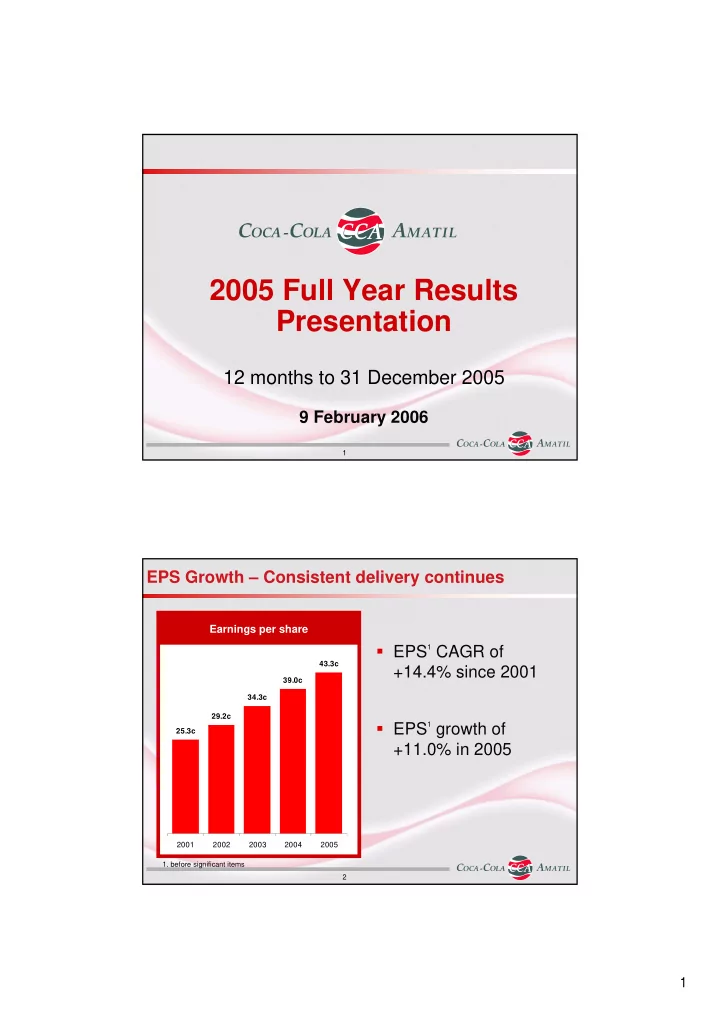
8
Group EBIT
1 10.1% to $570.6m
Beverage EBIT margin a healthy 15.5% Food EBIT margin 13.0% (10 months)
Standout result from Indonesia with 49.6% local currency EBIT growth
32.4% to $42.9m Indonesia & PNG1
Result better than expectations with strong local currency revenue growth in H2 of 10.2%
EBIT loss of $6.6m South Korea1
Solid earnings result despite an intensifying competitive environment
$45.7m (10 months) SPC Ardmona
Competitive trading conditions in New Zealand lead to under-recovery of COGS
12.1% to $72.0m Pacific
EBIT margin maintained in a competitive market
5.3% to $455.5m Australia
Solid group performance continues
- 1. before significant items