
SLIDE 1
1332 State Innovation Task Force Meeting Agenda
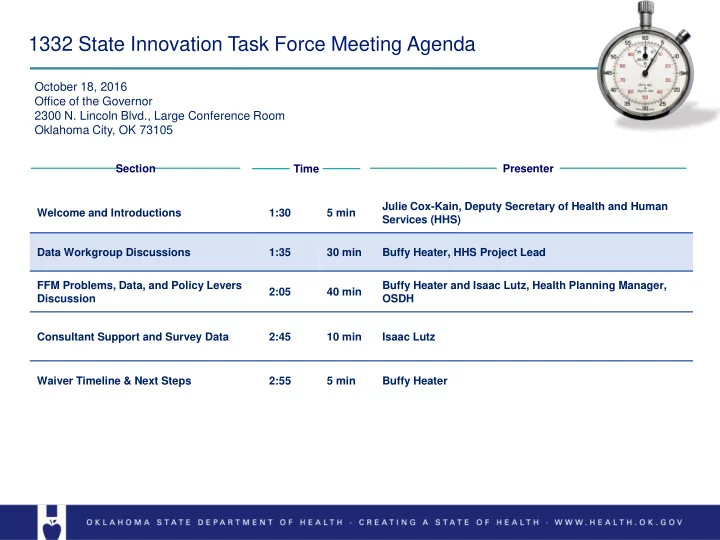
Presenter Section Welcome and Introductions 1:30 5 min Julie Cox-Kain, Deputy Secretary of Health and Human Services (HHS) Data Workgroup Discussions 1:35 30 min Buffy Heater, HHS Project Lead FFM Problems, Data, and Policy Levers Discussion 2:05 40 min Buffy Heater and Isaac Lutz, Health Planning Manager, OSDH Consultant Support and Survey Data 2:45 10 min Isaac Lutz Waiver Timeline & Next Steps 2:55 5 min Buffy Heater
October 18, 2016 Office of the Governor 2300 N. Lincoln Blvd., Large Conference Room Oklahoma City, OK 73105
Time