12/9/2019 Department of Veterinary and Animal Sciences Advanced - - PDF document

12 9 2019
SMART_READER_LITE
LIVE PREVIEW

12/9/2019 Department of Veterinary and Animal Sciences Advanced - - PDF document

12/9/2019 Department of Veterinary and Animal Sciences Advanced Quantitative Methods in Herd Management Autocorrelation Leonardo de Knegt Dan Brge Jensen Department of Veterinary and Animal Sciences Outline Definition Non-autocorrelated


slide-1
SLIDE 1

12/9/2019 1

Department of Veterinary and Animal Sciences

Advanced Quantitative Methods in Herd Management Autocorrelation

Leonardo de Knegt Dan Børge Jensen

Outline

Definition Non-autocorrelated data Autocorrelated data with no trend Autocorrelated data with simple trend Autocorrelated data with systematic trend (seasonality) Real examples in herd monitoring

Department of Veterinary and Animal Sciences Slide 2
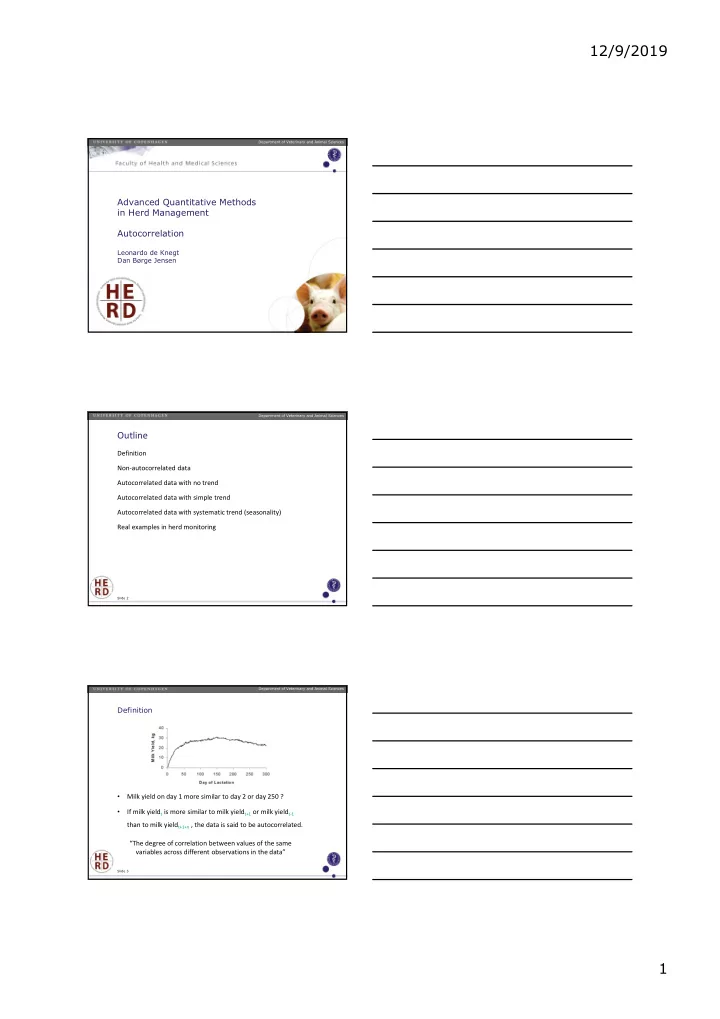
Definition

  • Milk yield on day 1 more similar to day 2 or day 250 ?

Department of Veterinary and Animal Sciences Slide 3

  • If milk yieldt is more similar to milk yieldt+1 or milk yieldt-1

than to milk yieldt+1+n , the data is said to be autocorrelated. “The degree of correlation between values of the same variables across different observations in the data”

slide-2
SLIDE 2

12/9/2019 2

Definition

  • Just as correlation measures the linear relationship

between two variables, autocorrelation measures the linear relationship between lagged values of a time series.

  • Most often discussed in the context of time series data
  • Same animal/object/herd observed at different

times

Department of Veterinary and Animal Sciences Slide 4

Definition Autocorrelation coefficients measures the relationship between yt and yt−k, where k is the length of the lag. ∑

  • , where T is the length of the time series.

Department of Veterinary and Animal Sciences Slide 5

Non-autocorrelated versus correlated Examples in R

Department of Veterinary and Animal Sciences Slide 6

slide-3
SLIDE 3

12/9/2019 3

Trend and seasonality

  • For data with simple, non-systematic trend
  • autocorrelations for small lags are large and positive

because observations nearby in time are also nearby in size.

  • the ACF of trended time series tend to have positive

values that slowly decrease as the lags increase.

  • You can reduce correlation using filters (EWMA)
  • For seasonal data (systematic trend)
  • autocorrelations are larger for the seasonal lags
  • e.g. 24 hours for pigs drinking behavior
  • Shewart on raw data and on forecast errors both useless
  • For data both trended and seasonal, you see a combination of

these effects.

Department of Veterinary and Animal Sciences Slide 7