
SLIDE 1
12/17/2019 1
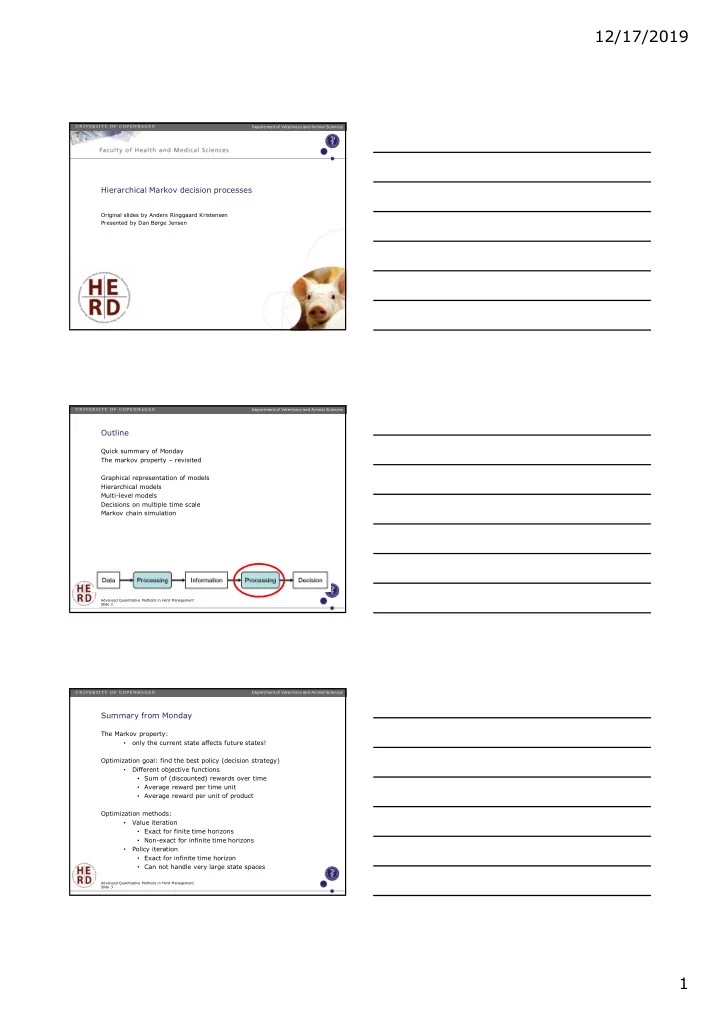
Hierarchical Markov decision processes
Original slides by Anders Ringgaard Kristensen Presented by Dan Børge Jensen
Department of Veterinary and Animal Sciences
Outline
Quick summary of Monday The markov property – revisited Graphical representation of models Hierarchical models Multi-level models Decisions on multiple time scale Markov chain simulation
Advanced Quantitative Methods in Herd Management Slide 2 Department of Veterinary and Animal Sciences
Summary from Monday
The Markov property:
- nly the current state affects future states!
Optimization goal: find the best policy (decision strategy)
- Different objective functions
- Sum of (discounted) rewards over time
- Average reward per time unit
- Average reward per unit of product
Optimization methods:
- Value iteration
- Exact for finite time horizons
- Non-exact for infinite time horizons
- Policy iteration
- Exact for infinite time horizon
- Can not handle very large state spaces
Advanced Quantitative Methods in Herd Management Slide 3 Department of Veterinary and Animal Sciences