11 6 13 i subcommittee overview ii overview of 2013 2014
play

11/6/13 I. Subcommittee Overview II. Overview of 2013-2014 Student - PowerPoint PPT Presentation

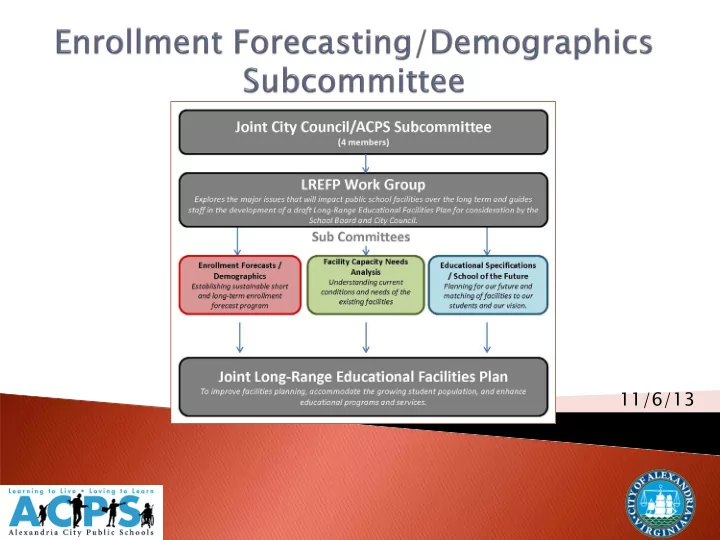
1 11/6/13 I. Subcommittee Overview II. Overview of 2013-2014 Student Enrollment III. Short-Term Projections- Proposed Methodology IV. Long-Term Forecast Update 2 I. Subcommittee Overview II. Overview of 2013-2014 Student Enrollment III.


  1. 1 11/6/13

  2. I. Subcommittee Overview II. Overview of 2013-2014 Student Enrollment III. Short-Term Projections- Proposed Methodology IV. Long-Term Forecast Update 2

  3. I. Subcommittee Overview II. Overview of 2013-2014 Student Enrollment III. Short-Term Projections- Proposed Methodology IV. Long-Term Forecast Update 3

  4.  Improve facilities planning, accommodate the growing student population, and enhance educational program and services.  Enrollment up 3,100 since 2007 (29.5% increase) 4

  5. Su Subcommi mmittee Role  Review the details of the forecasting research topics  Collaborate on the development of a short term and long term enrollment forecast  Report results to the LREFP workgroup 5

  6. Timeline line June une  Reviewed role of the subcommittee o Reviewed overall work program and research elements: births, cohort survival, o capture rates, student generation July ly  Reviewed research elements: housing affordability programs, aggregate cohort o survival, birth rates September  Reviewed research elements: market affordability, cohort survival by individual student o  Octob tober Reviewed current year enrollment numbers o Consolidated research elements to create short & long term assumptions o Reviewed multiple forecast scenarios o  Novem ember ber/December mber Produce preliminary long-term forecast o Produce recommended short-term and long-term forecasts o Develop process for regular updates o 6

  7.  Subcomm ommitte ttee Res Resear earch Topic opics 7

  8. Multip tiple le Enrol ollme lment F t Forecasts ts  Sh Shor ort Term ( rm (1-6 year 6 years) o Most specific forecast. Is done for every school by every grade. Informs near-term capacity and operating needs.  Mid id Term ( rm (6-10 year 10 years) o Is a citywide forecast. Informs the 10 year Capital Improvement Plan (CIP).  Long Ter Term ( (30 30 year years) o Is citywide forecast. Informs long term public facility needs. 8

  9. I. Subcommittee Overview II. Overview of 2013-2014 Student Enrollment  Overall  By Grade  Elementary Growth by Region  Actual versus Projected III. Short-Term Projections- Proposed Methodology IV. Long-Term Forecast Update 9

  10. October 1 Student Enrollment FY2014 FY2013  Total Enrollment: 13,622  Total Enrollment: 13,114 o 3.9% increase from FY13 o 5.6% increase from FY12 o K-12 Enrollment: 12,759 o K-12 Enrollment: 13,277 o Prek Enrollment: 276 o Prek Enrollment: 285  Growth  Growth o Elementary 5.9% o Elementary 2.3% o Middle School 4.3% o Middle School 7.9% o High School 5.7% o High School 5.2% 10

  11. 11

  12. Central: C. Barrett, D. MacArthur, G. Mason  East: C. Kelly, J.-Houston, L.-Crouch, M. Maury, Mt. Vernon West: J.K. Polk, J. Adams, P. Henry, S. Tucker, W. Ramsay 12

  13. FY2014 FY2014 Projection School Name Final FY2014 10/1/2013 Error FY2014 Projection Projected Grade Final 10/1/2013 Error Projected Charles Barrett Total 442 446 +.9% Cora Kelly Total 367 373 +1.6% PK 295 285 -3.4% Douglas MacArthur Total 715 704 -1.5% K 1,578 1,418 -10.1% George Mason 525 512 -2.5% 1 1,484 1,462 -1.5% James K. Polk 708 690 -2.5% 2 1,270 1,255 -1.2% Jefferson Houston 385 356 -7.5% 3 1,212 1,181 -2.6% John Adams 883 874 -1.% Lyles-Crouch 457 437 -4.4% 4 1,085 1,063 -2.% Matthew Maury 461 418 -9.3% 5 1,013 1,013 +.% Mount Vernon 836 768 -8.1% 6 897 946 +5.5% Patrick Henry 621 586 -5.6% 7 828 872 +5.3% Samuel Tucker 729 740 +1.5% 8 758 784 +3.4% William Ramsay 870 831 -4.5% ES Total 7,999 7,735 -3.3% 9 807 892 +10.5% Francis Hammond MS 10 861 845 -1.9% Francis Hammond MS 1 445 462 +3.8% 11 809 832 +2.8% Francis Hammond MS 2 449 459 +2.2% 12 716 714 -.3% Francis Hammond MS 3 447 465 +4.% Grand Total 13,613 13,562 -.37% George Washington MS George Washington MS 1 540 580 +7.4% George Washington MS 2 540 578 +7.% MS Total 2,421 2,544 +5.1% Minnie Howard Center 695 714 +2.7% TC Williams HS 2,498 2,569 +2.8% HS Total 3,193 3,283 +2.8% Grand Total 13,613 13,562 -.37% 13

  14. Subcommittee Overview I. Overview of 2013-2014 Student II. Enrollment III. Sh Short-Te Term rm Pro roject ctio ions- Prop opos osed III. Method odolog ogy  Foundat dations  Kin inderga gart rten Tre Trends and Ca Capture re Ra Rates  Co Cohort rt Surv rviv ival  En Enro rollm llment: His Historica rical l and Pro roject cted IV. Long-Term Forecast Update 14

  15.  Founda dation tion o of the Short rt- and nd Mi Mid-Term E rm Enrollme llment t Forecas casts o Changes in in birt births o Changes in in th the kin kinderg rgarten captu pture ra rate te o Cha hang nges i in n cohort s ort surv rviv ival l o Changes to s to stu tude dent ge genera ration ra rate te 15

  16.  Key Assumptions ◦ Births/Birth Rate  Increasing ◦ Kindergarten Capture Rate  FY2014 rate of .581 or 58.1% (projected 64%)  FY2013 rate of .66 or 66%  Recommend using 5-year average of 60.9% for projections 16

  17. Alexandria’s Birth Rates are higher than those of Northern Virginia and the nation as a whole. 17

  18.  Birth Data- Virginia Department of Health ◦ Births to Alexandria mothers ◦ Revised to ensure valid Alexandria addresses and adjust to months of kindergarten eligibility (October – September) Total Births 5 Kindergarten K FY Yrs Enrollment Capture Before 2,126 1,179 55.5% 2009 2,277 1,236 54.3% 2010 2,133 1,313 61.6% 2011 2,129 1,364 64.1% 2012 2,289 1,516 66.2% 2013 2,442 1,418 58.1% 2014 2,546 1,550 60.9% 2015 2,576 1,569 60.9% 2016 2,584 1,573 60.9% 2017 2,683 1,634 60.9% 2018 2,711 1,651 60.9% 2019 2,762 1,682 60.9% 2020 18

  19.  Compares the number of students in a grade to the number of students in the previous grade the previous school year.  Annual ratios are averaged and then used to project future enrollment.  Using a 3-year average for projections. 3-Year Average FY12-14 3-Year Average FY11-13 Lower Elementary (K-3) 96.4 Lower Elementary (K-3) 96.3 o o Upper Elementary (3-5) 97.5 Upper Elementary (3-5) 97.5 o o Middle School (6-8) 97.3 Middle School (6-8) 96.8 o o Lower High (8-10) 108.6 Lower High (8-10) 106.5 o o Upper High (10-12) 93.1 Upper High (10-12) 93.1 o o 19

  20. 20

  21. 3 Year Average Cohort Survival: Historical and Projected 120.0% Upper Lower Elem (3-5) MS 8th-10th 10th-12th Elem (k-3) 115.0% 95.8% 96.7% 96.0% 112.9% 82.5% FY00-02 110.0% 94.2% 94.0% 93.7% 106.7% 84.2% FY03-05 105.0% 93.3% 93.0% 94.1% 99.8% 90.9% FY06-08 100.0% 98.5% 98.5% 98.4% 106.5% 93.5% FY09-11 95.0% 96.4% 97.4% 97.3% 108.6% 93.1% Lower Elem FY12-14 90.0% (k-3) Upper Elem 96.2% 97.0% 95.5% 106.4% 92.3% FY15-17 85.0% (3-5) MS 96.7% 97.4% 95.2% 108.3% 92.2% 80.0% FY18-20 8th-10th FY00-02FY03-05FY06-08FY09-11FY12-14FY15-17FY18-20 21

  22. ACPS Enrollment Growth: Historical and Projected 20,000 FY 2014 15,000 13,622 11,203 10,339 10,000 FY 2007 5,000 - FY00 FY02 FY04 FY06 FY08 FY10 FY12 FY14 FY16 FY18 FY20 Actual Enrollment FY15Projected Enrollment- 3yr CSR Last Year's Projections 22

  23. 10,000 9,262 ACPS Enrollment by School Level: Past and Future 8,829 9,000 8,374 7,735 8,000 7,147 7,000 6,342 6,000 5,591 5,000 3,985 3,761 4,000 3,487 3,283 3,138 2,936 2,955 2,863 2,867 2,669 3,000 2,544 2,242 2,220 2,112 2,000 1,000 - ES MS HS FY2008 FY2009 FY2010 FY2011 FY2012 FY2013 FY2014 FY15 FY16 FY17 FY18 FY19 FY20 23

  24.  Calculate student generation rates for SY2013- 2014  Calculate detailed by school, by grade projections  Capacity Analysis to determine how the projections affect capacity 24

  25. Subcommittee Overview I. II. Overview of 2013-2014 Student Enrollment III. Short-Term Projections- Proposed Methodology IV. Lo Long ng-Ter erm F Forec recast Upda Update IV. 25

  26. Shor hort-Ter erm Forecas cast Long ong-Te Term F Forecas cast How will births and birth rates Known birt births for recent years change? Kinder erga garten en cap capture – recent How could kindergarten capture years average from known births change and why? Cohort rt s surv rviv ival by grade – recent How could cohort survival change? years average Students from new de develo lopm pment – Approved projects and po potentia ial l approved projects futu uture p proj ojects Student g nt gene nerati tion per housing unit for existing development and How could student generation to new projects – recent years change over time? average 26

  27. 27

Download Presentation
Download Policy: The content available on the website is offered to you 'AS IS' for your personal information and use only. It cannot be commercialized, licensed, or distributed on other websites without prior consent from the author. To download a presentation, simply click this link. If you encounter any difficulties during the download process, it's possible that the publisher has removed the file from their server.

Recommend


More recommend