10/23/2014 The average score (in bits) per alignment position when - - PDF document

10 23 2014 the average score in bits per alignment
SMART_READER_LITE
LIVE PREVIEW

10/23/2014 The average score (in bits) per alignment position when - - PDF document

10/23/2014 The average score (in bits) per alignment position when using a PAM M matrix to compare sequences in fact separated by D PAMs (Calculated by simulation) Score with PAM M Efficiency = Score with PAM D = 94% efficiency Altschul SF, J.


slide-1
SLIDE 1

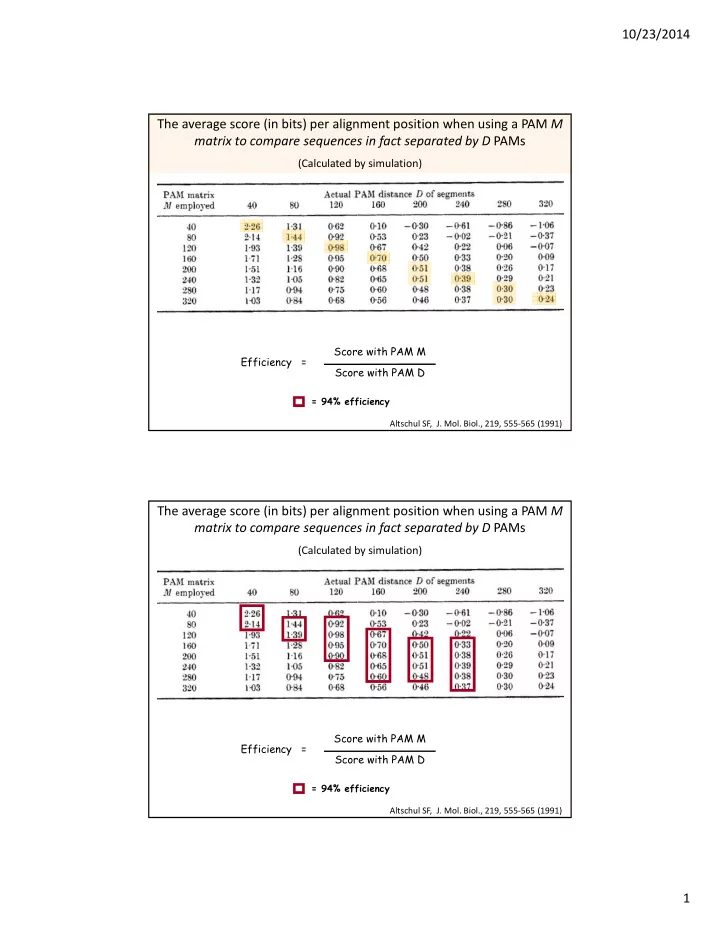
10/23/2014 1 The average score (in bits) per alignment position when using a PAM M matrix to compare sequences in fact separated by D PAMs

(Calculated by simulation)

Efficiency = Score with PAM M Score with PAM D

= 94% efficiency Altschul SF, J. Mol. Biol., 219, 555‐565 (1991)

The average score (in bits) per alignment position when using a PAM M matrix to compare sequences in fact separated by D PAMs

(Calculated by simulation)

Efficiency = Score with PAM M Score with PAM D

= 94% efficiency Altschul SF, J. Mol. Biol., 219, 555‐565 (1991)

slide-2
SLIDE 2

10/23/2014 2

BLOSUM PAM Sequence identity bits/site bits/site 20 2.95 83% 30 2.57 60 2.00 63% 70 1.60 90 1.18 100 1.18 43% 80 0.99 120 0.98 38% 60 0.66 160 0.70 30% 50 0.52 200 0.51 25% 45 0.38 250 0.36 20% The relative entropy of a substitution matrix is given in bits per position and can be calculated from S[] using the equations

j i n ij n

j i S q H

,

] , [

] , [ j i n S e p p q

j i ij n

  

and

  • The scale indicates % identity in local

alignments (MSPs).

  • The Twilight Zone

– Around 20%‐35% identity – Difficult to distinguish between MSPs in related sequences and “chance” alignments

The “Twilight” Zone

100 75 50 25 Pairwise searches PSSM/HMM searches Structure prediction % Identity Twilight zone

slide-3
SLIDE 3

10/23/2014 3

70.00 75.00 80.00 85.00 90.00 95.00 100.00 Mean: 84.8

First in‐class exam scores