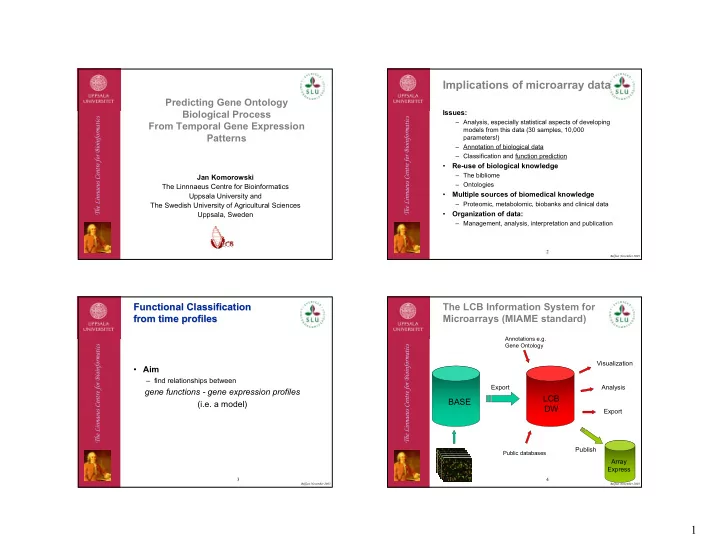

Implications of microarray data Predicting Gene Ontology Biological Process Issues: The Linnaeus Centre for Bioinformatics The Linnaeus Centre for Bioinformatics – Analysis, especially statistical aspects of developing From Temporal Gene Expression models from this data (30 samples, 10,000 Patterns parameters!) – Annotation of biological data – Classification and function prediction • Re-use of biological knowledge – The bibliome Jan Komorowski – Ontologies The Linnnaeus Centre for Bioinformatics • Multiple sources of biomedical knowledge Uppsala University and – Proteomic, metabolomic, biobanks and clinical data The Swedish University of Agricultural Sciences • Organization of data: Uppsala, Sweden – Management, analysis, interpretation and publication 2 Belfast November 2003 Functional Classification Functional Classification The LCB Information System for from time profiles from time profiles Microarrays (MIAME standard) Annotations e.g. Gene Ontology The Linnaeus Centre for Bioinformatics The Linnaeus Centre for Bioinformatics Visualization • Aim – find relationships between Export Analysis gene functions - gene expression profiles LCB BASE (i.e. a model) DW Export Publish Public databases Array Express 3 4 Belfast November 2003 Belfast November 2003 1
The data analysis process An Example: An Example: Microarray scans The Transcriptional Transcriptional Program in Program in The Image Analysis the Response Response of Human of Human the Feature Microarray data selection Fibroblasts to Serum to Serum Fibroblasts Hs. Cluster NAME SYMBOL P-value Hs.291 glutamyl aminopeptidase ENPEP 0 Filtering Hs.823 hepsin (transmembrane protease, serine 1) HPN 0 Hs.74861 activated RNA polymerase II transcription cofactor 4 PC4 0 Selected Hs.60478 ESTs, Moderately similar to protein HZF2 <Hs.60478> 0.001 Hs.284266 hypothetical protein MGC8471 MGC8471 0.001 genes Hs.96 phorbol-12-myristate-13-acetate-induced protein 1 PMAIP1 0.002 Hs.2025 transforming growth factor, beta 3 TGFB3 0.002 Filtered data Iyer et al, Science, 283: 83, 1999 Discretization Normalization PMAIP1 ENPEP TGFB3 <Hs.60478> MGC8471 ... Class [*, 0.036) [*, -0.046) [*, -0.152) [-0.124, 0.341) [-0.016, 0.318) ... Y [0.036, 0.440) [0.380, *) [0.108, *) [0.341, *) [0.318, *) ... Y [0.440, *) [0.380, *) [-0.152, 0.108) [0.341, *) [0.318, *) ... Y Discretized Normalizated data [*, 0.036) [*, -0.046) [*, -0.152) [*, -0.124) [*, -0.016) ... N [0.440, *) [0.380, *) [0.108, *) [-0.124, 0.341) [0.318, *) ... Y training [*, 0.036) [-0.046, 0.380) [0.108, *) [-0.124, 0.341) [-0.016, 0.318) ... Y [0.036, 0.440) [*, -0.046) [-0.152, 0.108) [-0.124, 0.341) [-0.016, 0.318) ... N data [0.440, *) [0.380, *) [0.108, *) [0.341, *) [0.318, *) ... Y [0.036, 0.440) [*, -0.046) [*, -0.152) Undefined [*, -0.016) ... N Data mining Undefined [-0.046, 0.380) [*, -0.152) [*, -0.124) Undefined ... N [*, 0.036) [*, -0.046) [0.108, *) [*, -0.124) [*, -0.016) ... N ∧ → <PMAIP1,[*, 0.036)> <PC4([-0.716,-0.073)> <Class,Y> Model Learning <PMAIP1,[*, 0.036)> ∧ <PC4([*,-0.716)> → <Class,N> Validation ∧ → <PMAIP1,[*, 0.036)> <PC4([-0.716, -0.073)> <Class,Y> Σ 8 hours serum treatment ∧ → <PMAIP1,[*, 0.036)> <PC4([*, -0.716)> <Class,N> <PMAIP1,[0.036, 0.440)> ∧ <PC4([*, -0.716)> → <Class,N> Quality estimate Rule model ∧ → <LTGFB3,[*, -0.152)> <MGC8471([-0.016, 0.318)> <Class,Y> of the model <TGFB3,[0.108, *)> ∧ <MGC8471([-0.016, 0.318)> → <Class,Y> 1, protein disulfide isomerase-related protein Interpretation 2, IL-8 precursor ! 3, EST AA057170 Knowledge 4, vascular endothelial growth factor 6 5 Belfast November 2003 Belfast November 2003 fibroblast serum response fibroblast serum response - wound healing - wound healing fibroblast fibroblast - - 24 h serum response 24 h serum response • blood coagulation and hemostasis (PAI1, Factor III, Endothelin-1) serum serum samples for microarray • chemotaxis and activation of immune cells analysis (COX2, MCP1, IL-8, ICAM-1) • angiogenesis (VEGF) 0 1 4 8 24 • migration and proliferation of fibroblasts (CTGF) quiescent proliferating • differensiation of fibroblast to myofibroblasts non-proliferating (vimentin) • migration and proliferation of keratinocytes 7 8 (FGF7) Belfast November 2003 Belfast November 2003 2
Molecular mechanisms of Molecular mechanisms of transcriptional response transcriptional response dynamic processes dynamic processes serum serum effectors effectors = signal = signal = cellular = cellular secondary delayed transcription response response immediate late early factors immediate intermediate early immediate early response factors 0 1 4 8 24 primary secondary tertiary intermediate/late response genes quiescent proliferating delayed non-proliferating immediate early immediate early response genes 9 10 response genes Belfast November 2003 Belfast November 2003 Protein dynamics is not always Protein dynamics is not always Protein appears after Protein appears after the transcript the transcript similar to transcript dynamics similar to transcript dynamics 0 1 4 8 24 0 1 4 8 24 primary secondary tertiary gene transcript protein quiescent proliferating non-proliferating 11 12 Belfast November 2003 Belfast November 2003 3
The dynamics dynamics of of cellular cellular processes processes The Processes Processes stress response cell motility cell adhesion re- -entry entry re stress stress response response DNA synthesis cell cycle cycle cell energy metabolism protein synthesis synthesis protein protein synthesis organelle organelle cell cycle regulation transcription transcription biogenesis biogenesis cell cell lipid synthesis lipid synthesis motility motility 1 4 8 24 DNA synthesis cell motility lipid synthesis 0 1 4 8 24 cell proliferation, negative regulation quiescent quiescent proliferating proliferating non-proliferating 13 14 non-proliferating Belfast November 2003 Belfast November 2003 co- co -regulation of genes regulation of genes co- co -regulation of genes regulation of genes coding for proteins in a network coding for proteins in a network coding for proteins in a network coding for proteins in a network furin CALLA/CD10 pro-endothelin active endothelin inactive endothelin pro-endothelin active endothelin inactive endothelin 15 16 Belfast November 2003 Belfast November 2003 4
+ furin furin CALLA/CD10 CALLA/CD10 + + pro-endothelin active endothelin inactive endothelin pro-endothelin active endothelin inactive endothelin 17 18 Belfast November 2003 Belfast November 2003 co- co -regulation of genes regulation of genes fibroblast serum fibroblast serum- -response response coding for proteins in a network coding for proteins in a network transcriptional program transcriptional program - 517 gene-probes with differential gene expression + furin CALLA/CD10 497 unique genes + pro-endothelin active endothelin inactive endothelin 284 known genes 213 unknown genes 19 20 Belfast November 2003 Belfast November 2003 5
Recommend
More recommend