1 Programmers often use analysis tools to improve program quality. - PDF document
1 Programmers often use analysis tools to improve program quality. These are just tools to analyze, or carefully examine, some aspect of a program. We can categorize program analyses into two groups: Static analysis involves analyzing a program's
1
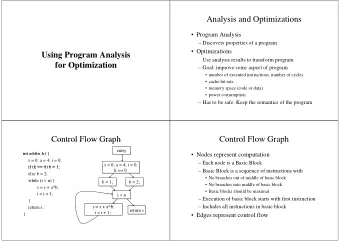
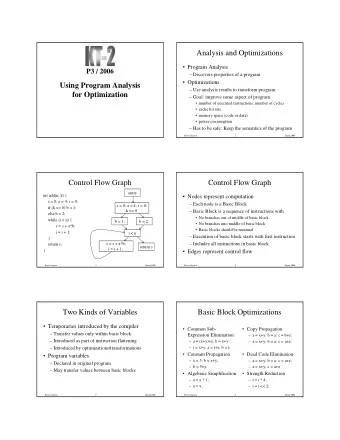
Programmers often use analysis tools to improve program quality. These are just tools to analyze, or carefully examine, some aspect of a program. We can categorize program analyses into two groups: Static analysis involves analyzing a program's source code or machine code without running it. Many tools perform static analysis, in particular compilers; examples of static analyses used by compilers include analyses for correctness, such as type checking, and analyses for optimization, which identify valid performance-improving transformations. Also, some standalone static analysis tools can identify bugs or help visualize code. Tools performing static analysis only need to read a program in order to analyze it. We’ll study static analysis after the first exam. 2
Dynamic analysis involves analyzing a client program as it executes. Many tools perform dynamic analysis, for example, profilers, checkers and execution visualizers. Tools performing dynamic analysis must instrument the client program with analysis code. The analysis code may be inserted entirely inline; it may also include external routines called from the inline analysis code. The analysis code runs as part of the program's normal execution, not disturbing the execution (other than probably slowing it down), but doing extra work .on the side., such as measuring performance, or identifying bugs. 2
We can categorize analysis into another two groups, based on the types of code being analyzed. Source analysis involves analyzing programs at the level of source code. Many tools perform source analysis; compilers are again a good example. This category includes analyses performed on program representations that are derived directly from source code, such as control- flow graphs. Source analyses are generally done in terms of programming language constructs, such as functions, statements, expressions, and variables. Binary analysis involves analyzing programs at the level of machine code, stored either as object code (pre-linking) or executable code (post-linking). This category includes analyses performed at the level of executable intermediate representations, such as byte- codes, which 3
run on a virtual machine. Binary analyses are generally done in terms of machine entities, such as procedures, instructions, registers and memory locations. 3
This table summarizes the different types of program analysis. You can have static analysis at both the source and binary levels. Or dynamic analysis at both the source and binary levels. 4
The tools we're going to talk about use dynamic binary analysis. These sorts of tools allow you to write some heavy-weight analyses that can be very useful for understanding how your application is actually using the hardware it's running on. Thus, it can be very useful for finding bugs that only occur at runtime and cannot be detected at the language level. Things like memory leaks or performance issues can be debugged using dynamic binary analysis. 5
DBA requires the program to be instrumented with analysis code There are two ways to instrument code for DBA: statically or dynamically (describe). The tools we'll look at use DBI. Advantages to DBI: First, it usually does not require the client program to be prepared in any way, which makes it very convenient for users. Second, it naturally covers all client code; instrumenting all code statically can be difficult if code and data are mixed or different modules are used, and is impossible if the client uses dynamically generated code. This ability to instrument all code is crucial for correct and complete handling of libraries. These advantages of DBI make it the best technique for many dynamic analysis tools. Disadvantages to DBI: 6
First, the cost of instrumentation is incurred at run-time. Second, it can be difficult to implement. There are now tools for adding DBI, which we're going to study. But if you need to do something outside these tools, it can be very difficult to implement DBI. 6
The first of these tools we will look at is Valgrind Valgrind is a tool for heavyweight analysis. By heavyweight I mean these tools instrument all (or most) instructions and they track a lot of metadata. There are more than a dozen tools that come with valgrind. We'll look at a three tools. MemCheck is memory error detector. This is probably the most common use of valgrind Cachegrind simulates how your program interacts with the cache hierarchy and branch predictor Massif is a heap profiler that can give you information about the memory allocation in your program 7
8
9
It is important to understand that your program can copy around junk (uninitialised) data as much as it likes. Memcheck observes this and keeps track of the data, but does not complain. A complaint is issued only when your program attempts to make use of uninitialised data in a way that might affect your program's externally-visible behaviour. In this example, x is uninitialised. Memcheck observes the value being passed to _IO_printf and thence to _IO_vfprintf, but makes no comment. However, _IO_vfprintf has to examine the value of x so it can turn it into the corresponding ASCII string, and it is at this point that Memcheck complains. 10
11
Cachegrind simulates how your program interacts with a machine's cache hierarchy and (optionally) branch predictor. It simulates a machine with independent first-level instruction and data caches (I1 and D1), backed by a unified second-level cache (L2). This exactly matches the configuration of many modern machines. However, some modern machines have three or four levels of cache. For these machines (in the cases where Cachegrind can auto-detect the cache configuration) Cachegrind simulates the first-level and last-level caches. The reason for this choice is that the last-level cache has the most influence on runtime, as it masks accesses to main memory. Furthermore, the L1 caches often have low associativity, so simulating them can detect cases where the code interacts badly with this cache (eg. traversing a matrix column-wise with the row length being a power of 2). Therefore, Cachegrind always refers to the I1, D1 and LL (last-level) caches. 12
13
So, for this example, we're going to look at a simple matrix multiply. Does anyone remember the matrix multiply? For each p[i][j], we take the values from row i in the first matrix and multiply them by the values from column j in the second matrix. OK, so here's a basic algorithm for matrix multiply. Notice here that we're accessing the values in row A along these rows, but in B we access the memory going down these columns So, if these matrices are stored in row-major order, in the actual address space, the memory would be laid out like this: A [R1 …….……. R2 ……………. R3 ……………. R4 ] B [R1 ………….. R2 …………….. R3 …………… R4 ] 14
But notice how this algorithm accesses this memory. A is accessed row by row, but B is accessed along its columns. With the way cache and memory hierarchies are designed, the hardware 'expects' memory that is close in the address space to be accessed together. So, say the cache loads 64 bytes from row R1 in A, it will access all 64 bytes before having another cache miss. With B, if we load 64 bytes, we might only access 8 bytes for one double. Then, on the next access, we have another cache miss to go to the next column. If arrays are stored in row-major order, this will cause bad cache performance because to compute every cell in A * B, we need traverse the columns in B. So, how could we fix this? 14
A simple solution is to store the second matrix with rows as columns and columns as rows, and modify the multiply algorithm to perform matrix multiplication over this modified structure. So, now, matrix B is stored like this: [C1 ………….. C2 …………….. C3 …………… C4 ] Where the values in the columns are now stored sequentially in memory. With this change, we can see the effect of the improved cache performance on our benchmark. 15
16
Improvement comes from differences in first level cache misses, which indicates that the matrix is small enough to fit in the L1 cache. We can also turn on --branch-sim=yes to see branch prediction rates. We did not change how the branches operate in these two versions, so these are mostly the same for this example. 17
18
This is an example program we'll use to try massif. It allocates an array of pointers to 1000 byte blocks of memory. Then, it allocates another 2000 bytes in function f and another 4000 bytes in function g. Then, it allocates another 4000 bytes in function g. It then frees the array of pointers. So, to run this, under valdgrind do: valgrind --tool=massif ./prog 19
20
Why is most of the graph empty, with only a couple of bars at the very end? By default, Massif uses "instructions executed" as the unit of time. For very short-run programs such as the example, most of the executed instructions involve the loading and dynamic linking of the program. The execution of main (and thus the heap allocations) only occur at the very end. For a short-running program like this, we can use the --time-unit=B option to specify that we want the time unit to instead be the number of bytes allocated/deallocated on the heap and stack(s) 21
Recommend
More recommend
Explore More Topics
Stay informed with curated content and fresh updates.
