
SLIDE 1
1
Statistics and analytical issues: SNP and GWAS
Linda Broer (l.broer@erasmusmc.nl) Genetic Laboratory Department of Internal Medicine Erasmus MC, Rotterdam
Overview
Genetic architecture of a trait Arrays GWAS Ethnicity Effect size / power Consortia
Overview
Genetic architecture of a trait Arrays GWAS Ethnicity Effect size / power Consortia
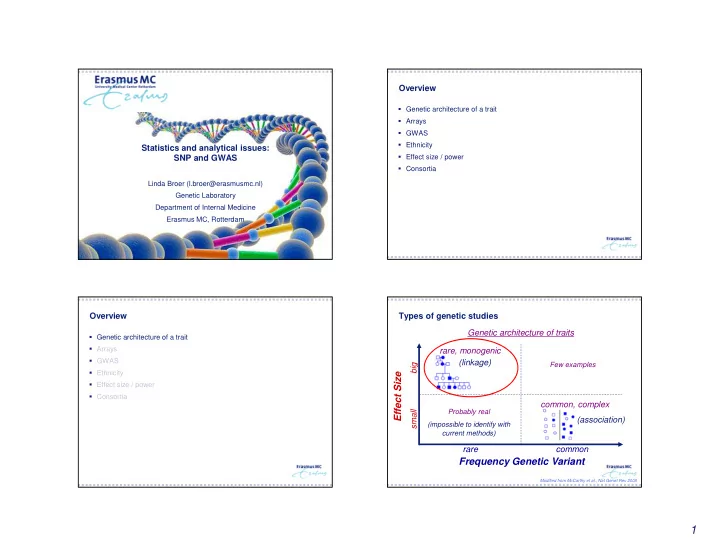
Types of genetic studies
Effect Size Frequency Genetic Variant
common, complex (association)
Probably real (impossible to identify with current methods) Few examples
rare common small big Genetic architecture of traits rare, monogenic (linkage)
Modified from McCarthy et al., Nat Genet Rev 2008