1
play

1 ECO/13/630492/SI.2.681277 Consortium Launching customer - PowerPoint PPT Presentation

Finescreen supported biological wastewater treatment to enhance plant capacity with resource (cellulose) recovery in public-private partnership Building the reference Kees Roest, Coos Wessels, Jos v. Lankveld, Robert Kras, Pim Marcelis, Theo


  1. Finescreen supported biological wastewater treatment to enhance plant capacity with resource (cellulose) recovery in public-private partnership Building the reference Kees Roest, Coos Wessels, Jos v. Lankveld, Robert Kras, Pim Marcelis, Theo van den Hoven 1 ECO/13/630492/SI.2.681277

  2. Consortium Launching customer Innovator, technology provider Research institute, coordinator Kees.Roest@KWRwater.nl 2 ECO/13/630492/SI.2.681277

  3. Objective of the Water board ▪ First and foremost: extension of the capacity of the waste water treatment plant ▪ Second: recycling of raw material from sewage ▪ The finescreen technique came out as the most economic way to extend the capacity of the waste water treatment plant ▪ Almost 30 % cheaper than the traditional way ▪ But, little experience on this scale (unknown impact on WWTP process and performance) ▪ Unknown to the operators ▪ First pilots ▪ Promising outcomes 3 ECO/13/630492/SI.2.681277

  4. Conclusions pilot research Less biological treatment needed Raw influent ✓ Limiting energy consumption biology ✓ Increasing biogas potential ✓ Reducing sludge production - smaller sludge dewatering lower polyelectrolyte (PE) consumption ✓ Limiting maintenance Recovery of a potentially interesting resource 4

  5. Screened material as resource

  6. Design & construction ▪ Design < 9 months ▪ Construction < year 6 ECO/13/630492/SI.2.681277

  7. Result 7 ECO/13/630492/SI.2.681277

  8. Sewage Treatment Plant Aarle Rixtel (NL) 8 ECO/13/630492/SI.2.681277

  9. Monitoring Plan 
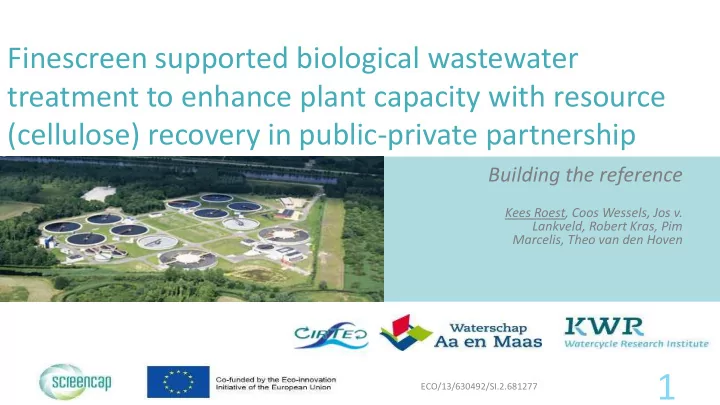
Sewage treatment plant Aarle-Rixtel consists of two identical parallel purification lanes AT1 and AT2. Finescreens have been installed on one of these lanes, so the performance of the "finescreen lane" can be compared with the conventional lane. The purpose of the monitoring plan is to determine: 1. performance of the finescreen installation (efficiency, energy consumption) 2. impact on sewage treatment process (compare treatment lanes AT1 and AT2) Performance and impact will be determined by: ▪ Measuring, sampling and analyzing in- and outgoing flows ▪ Parameters like concentration of suspended solids, COD, BOD, nitrogen components, phosphorous components ▪ Attention points are effluent quality, energy consumption and sludge characteristics like dewatering, settleability, sludge composition and sludge production 9 ECO/13/630492/SI.2.681277

  10. Operational Results ▪ Successful start-up in October 2016. ▪ Around Christmas & New Years Eve some broken filter meshes. ▪ Thereafter more stable operation because of continuous optimization. ▪ Improvement of finescreen cleaning (e.g. nozzles). ▪ Dewatering of finescreened material (mainly cellulosic material) is still challenging. ▪ Analytical measurements of cellulose, hemicellulose and lignin in sludge are challenging. ▪ Toxic load of ammonium in August 2017 -> End of Screencap monitoring period. 10 ECO/13/630492/SI.2.681277

  11. Results – Separation efficiency Finescreen performance: ▪ Solids particle size distribution of influent and effluent from the finescreens Sample Influent dry % of total Effluent dry % of total Efficiency solids influent dry solids effluent dry (%) (mg/L) solids (mg/L) solids Total 241 100 153 100 37 < 33 µm 136 56 120 79 11 33-54 µm 17 7 14 9 20 54-90 µm 10 4 7 4 32 90-158 µm 9 4 6 4 28 158-210 µm 5 2 2 2 57 210-250 µm 1 0 0 0 60 250-300 µm 10 4 3 2 67 300-350 µm 8 3 2 2 70 350-500 µm 14 6 2 1 87 500-840 µm 12 5 0 0 99 840-1000 µm 7 3 0 0 99 > 1000 µm 14 6 0 0 99 11 ECO/13/630492/SI.2.681277

  12. Results – Finescreen efficiency Performance of the finescreen installation: ▪ Production of finescreened material (screenings): 1275 kg dm/d ▪ Energy consumption: 53 W/m 3 – Total energy consumption, including the location-specific pumping step. Without pumping an energy-neutral/positive installation can possibly be achieved ▪ *) SS analyses conform NEN 872 using glass filter with pore size 1.2 µm Removal efficiency (net) SS* 20-25% COD 10-15% BOD 15% Nkj 2% • Cake layer Fouling (after cleaning) Ptot 2% 12 ECO/13/630492/SI.2.681277

  13. Results – Finescreen efficiency Screenings: Screencap results Production of finescreened 4777 kg/day material (screenings) 1275 kg ds/day 465 tds/y Dry solids content 26.7% Ash content 9% Fibers *) 67% Proteins 10% ▪ *) Fibers: Fat 8% – Cellulose 55 m% – Hemicellulose 7 m% Digestion of screenings: 2-3 times more biogas – Lignin 5 m% compared to digestion of surplus sludge 13 ECO/13/630492/SI.2.681277

  14. Results – Aeration energy Impact on sewage treatment process: AT1 = finescreen lane → Approximately 15% decrease in m 3 aeration (= energy) ▪ ▪ AT2 = conventional lane Start-up finescreens AT 1 AT 2 Aeration (m 3 /d) 126,490 149,686 Electricity for 3,137 3,587 aeration (kWh/d) 14 ECO/13/630492/SI.2.681277

  15. Results – Sludge production Impact on sewage treatment process: ▪ AT1 = finescreen lane → Approximately 10% decrease in sludge production ▪ AT2 = conventional lane AT 1 AT 2 SS (g/L) 4.9 5.2 Start-up finescreens Ash content (%) 25 23 SVI (ml/g) 73 72 Fiber content 216 398 (#/ml) Surplus sludge 206 228 (tds/mnd) 15 ECO/13/630492/SI.2.681277

  16. Results - Microscopy AT1 (with finescreens) AT2 (conventional) Counted indication: AT1: 216 fibers/ml AT2: 398 fibers/ml Influent finescreens Effluent finescreens Drain water 16 ECO/13/630492/SI.2.681277

  17. Results – Effluent quality Impact on sewage treatment process: ▪ AT1 = finescreen lane ▪ AT2 = conventional lane ▪ AT1 & AT2: in-line measurements ▪ Effluent 1 & total effluent: 24-hours composite sample AT 1 AT 2 Effl 1 Effl 2 Effl total ▪ Effluent 2: grab samples COD (mg/L) 44 44 43 Nkj (mg/L) 4.6 4.7 4.6 NH 4 (mg/L) 3.3 ± 1.9 4.0 ± 2.1 2.7 2.9 3.2 NO 3 (mg/L) 3.5 ± 3.3 2.3 ± 2.1 3.3 2.1 3.8 PO 4 (mg/L) 0.7 ± 0.8 0.8 ± 0.8 0.5 0.6 0.6 17 ECO/13/630492/SI.2.681277

  18. Summary/Conclusions Finescreen performance: ▪ 20-25% SS removal, 10-15% COD removal & 15% BOD removal ▪ Production finescreened material: 1275 kg ds/day – – 26.7% dry solids 2-3 times more biogas compared to digestion of surplus sludge – Impact on sewage treatment process: ▪ Comparable Sludge Volume Index (SVI) in AT1 (with finescreen) and AT2 ▪ No negative impact on removal of P and N ▪ Comparable effluent quality from AT1 and AT2 Approximately 15% decrease in m 3 aeration (= energy) in AT1 ▪ ▪ Approximately 10% lower sludge production in AT1 (with finescreen) ▪ No negative impact on dewatering of sludge, but slight decrease in polyelectrolyte use ▪ Increased WWTP capacity (person equivalents) approximately 10% 18 ECO/13/630492/SI.2.681277

  19. Thanks for your attention Launching customer Innovator, technology provider Research institute, coordinator Kees.Roest@KWRwater.nl 19 ECO/13/630492/SI.2.681277

Download Presentation
Download Policy: The content available on the website is offered to you 'AS IS' for your personal information and use only. It cannot be commercialized, licensed, or distributed on other websites without prior consent from the author. To download a presentation, simply click this link. If you encounter any difficulties during the download process, it's possible that the publisher has removed the file from their server.

Recommend


More recommend