
SLIDE 1
1
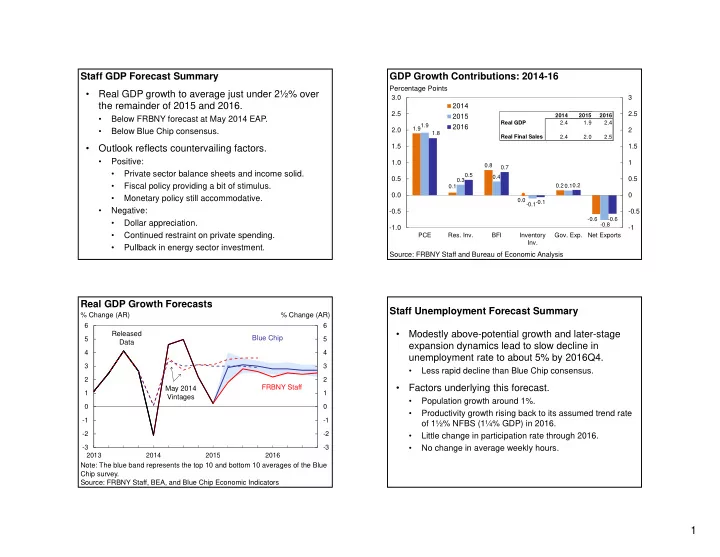
Staff GDP Forecast Summary
- Real GDP growth to average just under 2½% over
the remainder of 2015 and 2016.
- Below FRBNY forecast at May 2014 EAP.
- Below Blue Chip consensus.
- Outlook reflects countervailing factors.
- Positive:
- Private sector balance sheets and income solid.
- Fiscal policy providing a bit of stimulus.
- Monetary policy still accommodative.
- Negative:
- Dollar appreciation.
- Continued restraint on private spending.
- Pullback in energy sector investment.
- 3
- 2
- 1
1 2 3 4 5 6 2013 2014 2015 2016
- 3
- 2
- 1
1 2 3 4 5 6
Real GDP Growth Forecasts
% Change (AR) % Change (AR) Note: The blue band represents the top 10 and bottom 10 averages of the Blue Chip survey. FRBNY Staff Released Data Blue Chip Source: FRBNY Staff, BEA, and Blue Chip Economic Indicators May 2014 Vintages
1.9 0.1 0.8 0.0 0.2
- 0.6
1.9 0.3 0.4
- 0.1
0.1
- 0.8
1.8 0.5 0.7
- 0.1
0.2
- 0.6
- 1
- 0.5
0.5 1 1.5 2 2.5 3
- 1.0
- 0.5
0.0 0.5 1.0 1.5 2.0 2.5 3.0 PCE
- Res. Inv.
BFI Inventory Inv.
- Gov. Exp.
Net Exports
2014 2015 2016
GDP Growth Contributions: 2014-16
Percentage Points
2014 2015 2016 Real GDP 2.4 1.9 2.4 Real Final Sales 2.4 2.0 2.5
`
Source: FRBNY Staff and Bureau of Economic Analysis
Staff Unemployment Forecast Summary
- Modestly above-potential growth and later-stage
expansion dynamics lead to slow decline in unemployment rate to about 5% by 2016Q4.
- Less rapid decline than Blue Chip consensus.
- Factors underlying this forecast.
- Population growth around 1%.
- Productivity growth rising back to its assumed trend rate
- f 1½% NFBS (1¼% GDP) in 2016.
- Little change in participation rate through 2016.
- No change in average weekly hours.