SLIDE 1 1
High throughput genotyping techniques
Linda Broer l.broer@erasmusmc.nl Department of Internal Medicine Human Genetics Facility (HuGe-F)
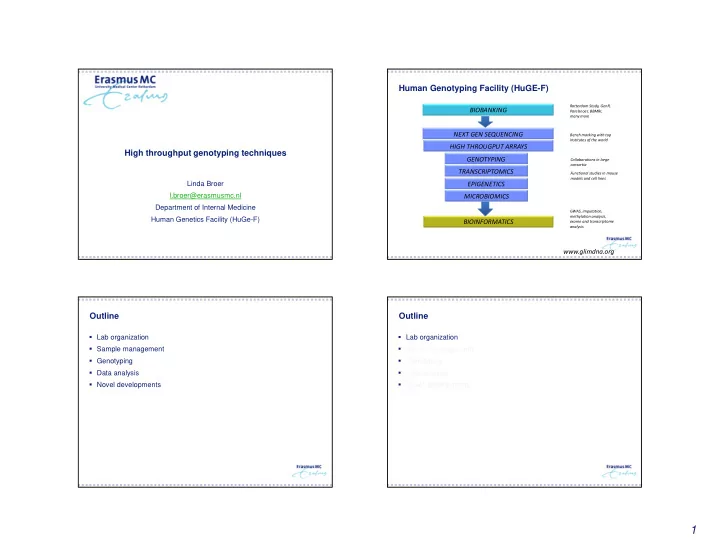
Human Genotyping Facility (HuGE-F)
BIOBANKING
Rotterdam Study, GenR, Parelsnoer, BBMRI, many more
GENOTYPING
Bench marking with top institutes of the world
NEXT GEN SEQUENCING
Collaborations in large consortia
BIOINFORMATICS
GWAS, imputation, methylation analysis, exome and transcriptome analysis
TRANSCRIPTOMICS EPIGENETICS HIGH THROUGPUT ARRAYS MICROBIOMICS
Functional studies in mouse models and cell lines
www.glimdna.org
Outline
Lab organization Sample management Genotyping Data analysis Novel developments
Outline
Lab organization Sample management Genotyping Data analysis Novel developments
SLIDE 2 2
Laboratory organization
Wet lab: working on biological samples Pre-PCR area Post-PCR area Technicians, PhD students, PostDocs Dry lab: working on data-analysis (Bio)Informaticians, PhD students, PostDocs
Outline
Lab organization Sample management Genotyping Data analysis Novel developments
Performing a genetic association study
v
Sample preparation Success of your study depends largely on DNA quality and proper storage and handling
Blood/tissue collection DNA-isolation Quality control Sample processing control Storage
SLIDE 3 3
DNA isolation
Many kits available for DNA isolation Choice depends on: Quantity & molecular weight of DNA Required purity Time & expense
Blood/tissue collection DNA-isolation Quality control Sample processing control Storage
DNA isolation from blood
Magnetic particle-based method (Promega, others) Easy to automate Low hands-on time Salting-out No automation Lot of hands-on time
DNA quality control
DNA quality measurement Testing degradation of DNA on agarose gel Purity (OD 260/280 > 1.7) Pico green measurement
Blood/tissue collection DNA-isolation Quality control Sample processing control Storage
DNA quality
DNA with inpurity High molecular weight DNA, little smearing Lower molecular weight DNA with degradation RNA contamination
SLIDE 4 4
Sample processing control
Gender determination to find sample swaps Different blanc positions per plate GWAS Unsuspected twinning Call rate Heterozygosity outliers
Blood/tissue collection DNA-isolation Quality control Sample processing control Storage
Sample swap detection
Gender determination: a way to find swaps of samples during: Collection phase DNA isolation Plating out (reformatting) Swaps can only be detected in male-female studies Only part of the swaps can be found Same gender swaps not detected
% of sample swaps (determined by gender check)
1 2 3 4 5 6 7 8 9 10 study 1 study 2 study 3 study 4 study 5 study 6 study 7
Storage of DNA
Work-solution: 4 oC Long-term storage: -20 oC
Blood/tissue collection DNA-isolation Quality control Sample processing control Storage
SLIDE 5 5
Outline
Lab organization Sample management Genotyping Data analysis Novel developments Sequencing Many techniques
Population genetics: technology driven
- Time required for genotyping 1 SNP in 7.000 DNA samples from “the Rotterdam Study”:
- 1996
6 months: RFLP, Epp tubes
3 months: RFLP, 96-well plates
1 week: SBE, 384-well plates
1 day: Taqman (manual)
6 hrs: Taqman (automated)
3 hrs: Taqman, Deerac, “Fast” PCR
6 sec: Illumina 1000K array, 1000 DNAs/week 2010 0.00001 sec Illumia Hiseq, next-gen sequencing
0.000001 sec Illumina X10
Population genetics: technology driven
- Time required for genotyping 1 SNP in 7.000 DNA samples from “the Rotterdam Study”:
- 1996
6 months
3 months
1 week
1 day
6 hrs
3 hrs
6 sec 2010 0.00001 sec
0.000001 sec
Association study with 1 DNA variant Association study with all common DNA variants in one gene Genome-wide association study
Sequencing: causal alleles?
SLIDE 6
6
Which genotyping technique to use? Array-technology for genotyping SNPs
Created for genotyping many SNPs (> 0.3 million) Two major companies: Illumina & Affymetrix (ThermoFisher) Illumina: tagSNP optimized Affymetrix: population-specific arrays Primarily used for Genome-wide testing GWAS But also for: pharmacogenetics, clinical research, linkage analysis
What is a Genome-Wide Association Study?
Method for interrogating all common variations across human genome Based on classic association study design GWAS is based on “Linkage Disequilibrium”: Variation inherited in groups, or blocks, so not all (millions) of variants have to be tested
One SNP May Serve as Proxy for many others
SNP2
↓
SNP3
↓
SNP4
↓
SNP5
↓
SNP6
↓
SNP1
↓
SNP7
↓
SNP8
↓
CAGATCGCTGGATGAATCGCATCTGTAAGCAT CGGATTGCTGCATGGATCGCATCTGTAAGCAC CAGATCGCTGGATGAATCGCATCTGTAAGCAT CAGATCGCTGGATGAATCCCATCAGTACGCAT CGGATTGCTGCATGGATCCCATCAGTACGCAT CGGATTGCTGCATGGATCCCATCAGTACGCAC
SLIDE 7
7
CAGATCGCTGGATGAATCGCATCTGTAAGCAT CGGATTGCTGCATGGATCGCATCTGTAAGCAC CAGATCGCTGGATGAATCGCATCTGTAAGCAT CAGATCGCTGGATGAATCCCATCAGTACGCAT CGGATTGCTGCATGGATCCCATCAGTACGCAT CGGATTGCTGCATGGATCCCATCAGTACGCAC
SNP2
↓
SNP3
↓
SNP4
↓
SNP5
↓
SNP6
↓
SNP1
↓
Block 1 Block 2
SNP7
↓
SNP8
↓
One SNP May Serve as Proxy for many others
CAGATCGCTGGATGAATCGCATCTGTAAGCAT CGGATTGCTGCATGGATCGCATCTGTAAGCAC CAGATCGCTGGATGAATCGCATCTGTAAGCAT CAGATCGCTGGATGAATCCCATCAGTACGCAT CGGATTGCTGCATGGATCCCATCAGTACGCAT CGGATTGCTGCATGGATCCCATCAGTACGCAC
SNP3
↓
SNP5
↓
SNP6
↓
Block 1 Block 2
SNP7
↓
SNP8
↓
One SNP May Serve as Proxy for many others
CAGATCGCTGGATGAATCGCATCTGTAAGCAT CGGATTGCTGCATGGATCGCATCTGTAAGCAC CAGATCGCTGGATGAATCGCATCTGTAAGCAT CAGATCGCTGGATGAATCCCATCAGTACGCAT CGGATTGCTGCATGGATCCCATCAGTACGCAT CGGATTGCTGCATGGATCCCATCAGTACGCAC
SNP3
↓
SNP5
↓
Block 1 Block 2
SNP8
↓
One SNP May Serve as Proxy for many others
Imputations
SLIDE 8 8
Imputation quality for different arrays Bead design
Each silica bead is 3 µm in diameter 23 bp address: unique sequence for each bead-type Address is used to identify the beads on the array 50 bp allele-specific probe
Probe Address 23 b 50 b
Procedure (day 1)
DNA normalization and whole genome amplification
DNA pellet after amplification 200 ng DNA Whole genome amplification
Procedure (day 2)
Hybridization on array, single base extension SBE: 1 base added to the probe
Fragmented gDNA SNP Labelled ddNTP
T-DNP
Address Probe Address Probe bead bead
SLIDE 9 9
Procedure (day 3) Procedure (day 3)
DNA collection on array Every dot represents a SNP Colors: Red & green: homozygous Yellow: heterozygous
Running genotyping arrays: problems encountered
DNA ARRAY
Hybridization on array Signal visualization DMAP file Arrays are scanned DNA-Amplification Bad quality: degradation, contaminated Bad quality arrays Reagens failure Corrupted, missing Scanner failure Robot problems
Outline
Lab organization Sample management Genotyping Data analysis Novel developments
SLIDE 10 10
Analysis of array data
Generate intensity data for 2 alleles Assign genotypes based on clustering (Almost) no manual review of data too many SNPs Low MAF SNPs are most difficult to call Different pipeline depending on manufacturer of array
GenomeStudio
Genotype clusters Information
samples Genotype per sample
A SNP cluster plot Same SNP different view
SLIDE 11
11
Quality of genotypes GenTrain Score: overall quality score Quality of genotypes AB T mean: Location of heterozygote clusters
SLIDE 12
12
Extreme location of heterozygote cluster How are genotype clusters determined?
Manifest file probe information Cluster file location of AA, AB and BB clusters Commercial arrays provided by Illumina All cleaning of clusters performed for you Custom arrays need to create yourself A lot of manual checking of clusters based on QC values
Quality of samples
Percentage of genotyped variants 10th percentile of distribution of GenCall scores
Export options from GenomeStudio
Very flexible! Every table can be subset to desired columns and exported Final report files can contain any number of columns Plink plug-in available Major QC and analysis software
SLIDE 13
13
Axiom Analysis Suite Axiom Analysis Suite
Parallelization possible! If your computer has enough capacity Not possible to change QC settings after run has started You need to restart the run if you want to change anything
Summary results Some interesting statistics
SLIDE 14
14
Sample Table Export options from Axiom Analysis Suite
Exports are less flexible compared to Illumina Plink export available VCF file export available One nice feature genotype call to functional allele transformation Pharmacogenetics
Pharmacogenetic calls Determine how well drugs are metabolized
SLIDE 15
15
Helps separate patients in groups QC after exporting from software: finding bad SNPs
Use quality control checks (plink) Call Rate Mendelian Inheritance Replicates Hardy-Weinberg Equilibrium Note that some bad SNPs will pass any QC filter Reversely, some good SNPs may fail QC
QC after exporting from software: finding bad samples
Quality control (plink) Call rate Excess Heterozygosity contamination Gender check
Verifying gender check in Illumina’s Genome Studio
SLIDE 16
16
Incidental findings To be careful with
Multiple sample types in one study Look at data by sample type AVOID batches of cases VS controls, mix them on the plates
GWAS analysis
Replication Select SNPs Meta-Analysis of all data Combine GWASs Analyzing all SNPs in 1 run Visualizing results in plots Manhattan-plot Each dot represents 1 SNP
Outline
Lab organization Sample management Genotyping Data analysis Novel developments
SLIDE 17 17
Price genotyping arrays
100 200 300 400 500 600 700 800 2007 2008 2009 2010 2011 2012 2013 2014 2015 2016
28 euro: GWAS + clinical research content, HLA typing, pharmacogenetics
GWAS arrays now contain more: Actionable genes GWAS arrays now contain more: HLA typing GWAS arrays now contain more: Pharmacogenetics
SLIDE 18 18
Ongoing efforts in Genome-wide Genetics
Unanswered Questions….: Biology: Causative SNP ? Causative gene ? Mechanism ? Prediction: Limited explained variance per trait/disease : …“dark matter”
- The Hunt for Genetic “Dark Matter”:
“Rare” variants Other type of sequence variation: Copy Number Variations Repeated Sequences (VNTR, telomeres, mitochondria)
- Technological Developments:
High Throughput Sequencing
Questions