
SLIDE 1
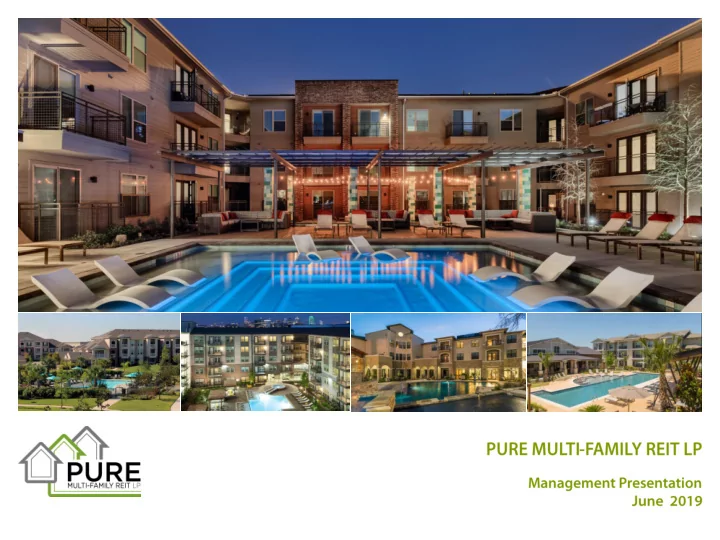
1 Pure Multi-Family REIT LP - - PowerPoint PPT Presentation
THIS PRESENTATION AND ITS CONTENTS ARE CONFIDENTIAL AND ARE NOT FOR PUBLIC DISTRIBUTION This presentation has been prepared for information purposes only. Certain information in Forward-looking statements are provided for the purpose of presenting
This presentation has been prepared for information purposes only. Certain information in this presentation contains forward-looking information within the meaning of applicable securities laws (also known as forward-looking statements) including, among others, statements made or implied relating to Pure Multi-Family REIT LP (“Pure Multi-Family”) and its objectives, strategies to achieve those objectives, beliefs, plans, estimates, projections and intentions; and similar statements concerning anticipated future events, results, circumstances, performance or expectations that are not historical facts. Forward-looking statements generally can be identified by words such as “outlook”, “believe”, “expect”, “may”, “anticipate”, “should”, “intend”, “estimates” and similar expressions. In particular, certain statements in this presentation discuss Pure Multi-Family’s anticipated future events. These statements include, but are not limited to: (i) Pure Multi-Family’s growth strategy, including the accretive acquisition of properties and the anticipated extent of the accretion of any acquisitions, which could be impacted by demand for properties and the effect that demand has on acquisition capitalization rates and changes in the cost of capital; (ii) maintaining occupancy levels and rental revenue, which could be impacted by changes in demand for Pure Multi-Family’s properties, financial circumstances of tenants, including tenant defaults, the effects of general economic conditions and supply of competitors’ properties in proximity to Pure Multi-Family’s properties; (iii)
Pure Multi-Family is able to achieve, fair value of its properties and future financing
(iv) tax status of Pure US Apartments REIT Inc., which can be impacted by regulatory changes enacted by governmental authorities; (v) anticipated distributions and payout ratios, which could be impacted by capital expenditures, results of operations and capital resource allocation decisions; (vi)
(vii) anticipated interest rates and exchange rates; (viii) anticipated population and government growth projections in markets in which Pure Multi-Family operates or intends to operate; (ix) the review of strategic options available to Pure Multi-Family by a special committee of the board of directors; and (x) scalability of the internalized property management platform. Forward-looking statements are provided for the purpose of presenting information about management’s current expectations and plans relating to the future and readers are cautioned that such statements may not be appropriate for other purposes. Forward-looking statements involve significant risks and uncertainties and should not be read as guarantees of future performance or results. Those risks and uncertainties include, among
interest rate and other debt related risk; tax risk; ability to access capital markets; lease rollover risk; competition for real property investments; environmental matters; changes in legislation; and indebtedness of Pure Multi-Family. Management believes that the expectations reflected in forward-looking statements are based upon reasonable assumptions and information currently available, which include, management’s current expectations, estimates and assumptions that: proposed acquisitions will be completed on the terms and basis agreed to by Pure Multi-Family, property acquisition and disposition prospects and opportunities will be consistent with Pure Multi-Family’s experience over the past 12 months, the multi-family residential real estate market in the “Sunbelt” region in the United States will remain strong, the global economic environment will remain stable, interest rates will remain at current levels, and Pure Multi-Family’s business strategy, plans, outlook, projections, targets and operating costs will be consistent with Pure Multi-Family’s experience over the past 12 months, Pure Multi-Family will be able to maintain occupancy at current levels, tenants will not default on lease terms, governmental regulations and taxation will not change to adversely affect Pure Multi-Family’s business and financial results, and Pure Multi-Family will be able to obtain adequate insurance and financing; however, management can give no assurance that actual results will be consistent with these forward-looking statements. Readers are cautioned that the foregoing list of factors that may affect future results is not
Pure Multi-Family, investors and others should carefully consider the foregoing factors and
please refer to the “Risk Factors” section in Pure Multi-Family’s annual information form and
These forward-looking statements are made as of the date of this presentation and Pure Multi-Family assumes no obligation to update or revise them to reflect new events or circumstances, except as required by applicable securities laws.
THIS PRESENTATION AND ITS CONTENTS ARE CONFIDENTIAL AND ARE NOT FOR PUBLIC DISTRIBUTION
Brackenridge, San Antonio, Texas
Pure Multi-Family REIT LP .......................................................... 3 Growth Strategy .......................................................................... 4 U.S. vs Canada Deal Flow ............................................................ 5 Sunbelt Growth Continues .......................................................... 6 Texas Triangle ............................................................................. 7 Dallas, Texas ................................................................................ 8 PURE Farmers Market, Dallas, Texas .......................................... 9 PURE Fillmore Apartments, Phoenix, Arizona .......................... 10 Recycling Capital ....................................................................... 11 Total Returns Since IPO ............................................................. 12 Total Unitholder Returns .......................................................... 13 Same Property Growth ............................................................. 14 Debt Profile ............................................................................... 15 Rent and Occupancy Trends ..................................................... 16 Q4 2018 Financial Snapshot...................................................... 17 Outlook ..................................................................................... 18
A Current Portfolio ................................................................. 20 B Capex vs Maintenance Reserves ......................................... 21 C Texas Property Tax Process ................................................. 22 D Analyst Coverage ................................................................. 23
Potential Future Markets Phoenix
NV CO
FL GA NC Dallas San Antonio Austin
Orlando Tampa Charlotte Raleigh Denver Las Vegas Miami
CA NM OR WA MT ID WY UT ND SD NE KS OK MO IA MN KY IL IN OH WV VA WI AR LA MS AL SC TN PA MI
MI
NY ME
NH VT MA CT NJ
Current Portfolio Houston
RI Atlanta DE MD DC
(1) As at March 31, 2019.
Source: US Data: Real Capital Analytics. Note: 2018 Average Annual CADUSD Exchange Rate = CAD$1.295: Source X-Rates.com. Source: Canadian Data: CBRE
Total Sales: Canada (2018) CAD
Existing Markets (Billion $) USD CAD Austin 3.753 4.860 Dallas 9.259 11.990 Houston 7.681 9.947 Phoenix 6.410 8.301 San Antonio 2.506 3.245
Target Markets (Billion $) USD CAD Atlanta 7.502 9.715 Charlotte 2.766 3.582 Orlando 3.180 4.118 Raleigh/Durham 3.176 4.113 Tampa 2.943 3.811 Denver 5.130 6.643
USD CAD
Source: Moody's Analytics, April 2018. (Survey includes 35 largest MSA's in the USA).
2017 – 2022 Annualized 2017 - 2022 Annualized
1 Austin-Round Rock TX 114,800 22,960 11.2% 1 Orlando-Kissimmee FL 388,300 77,660 15.5% 2 Orlando-Kissimmee FL 139,100 27,820 11.1% 2 Austin-Round Rock TX 297,100 59,420 14.1% 3 Dallas-Fort Worth TX 373,800 74,760 10.3% 3 Las Vegas-Henderson NV 290,500 58,100 12.9% 4 Houston-Sugar Land TX 311,500 62,300 10.2% 4 Phoenix-Scottsdale AZ 536,900 107,380 11.4% 5 San Antonio-New Braunfels TX 102,800 20,560 9.9% 5 Charlotte-Gastonia NC-SC 268,800 53,760 10.6% 6 Phoenix-Scottsdale AZ 172,000 34,400 8.5% 6 Atlanta-Roswell GA 615,000 123,000 10.5% 7 Las Vegas-Henderson NV 80,900 16,180 8.0% 7 Dallas-Fort Worth TX 711,500 142,300 9.7% 8 Tampa-St. Petersburg FL 98,900 19,780 7.4% 8 Houston-Sugar Land TX 641,500 128,300 9.3% 9 Miami-Kendall FL 82,300 16,460 7.0% 9 Tampa-St. Petersburg FL 260,800 52,160 8.5% 10 Seattle-Bellevue WA 112,000 22,400 6.6% 10 San Antonio-New Braunfels TX 200,700 40,140 8.1% 11 Charlotte-Gastonia NC-SC 71,900 14,380 6.1% 11 Seattle-Bellevue WA 220,200 44,040 7.4% 12 Columbus OH 64,000 12,800 5.9% 12 Miami-Kendall FL 185,000 37,000 6.7% 13 Atlanta-Roswell GA 152,100 30,420 5.5% 13 Denver-Aurora CO 177,500 35,500 6.1% 14 Denver-Aurora CO 79,900 15,980 5.5% 14 Columbus OH 108,400 21,680 5.2% 15 Minneapolis-Bloomington MN-WI 106,400 21,280 5.3% 15 Indianapolis-Anderson IN 97,200 19,440 4.8% 16 Indianapolis-Anderson IN 56,200 11,240 5.3% 16 Minneapolis-Bloomington MN-WI 167,500 33,500 4.7% 17 Riverside-Ontario CA 64,500 12,900 4.5% 17 Washington DC-Alexandria VA-MD 222,200 44,440 4.5% 18 Boston-MA 53,700 10,740 4.3% 18 San Francisco-Redwood City CA 62,400 12,480 3.8% 19 San Diego-Carlsbad CA 60,700 12,140 4.2% 19 San Jose-Santa Clara CA 72,200 14,440 3.6% 20 Cincinnati OH-KY-IN 44,000 8,800 4.0% 20 Sacramento-Roseville CA 79,000 15,800 3.4%
Numeric Change Numeric Change
Rank MSA % Change Rank MSA % Change
Sources:
(1) Fred Economic Data - https://fred.stlouisfed.org/series/TXNGSP (2) The World Bank - https://data.worldbank.org/indicator/NY.GDP.MKTP.CD?cid=GPD_29&end=2016&locations=CA&name_desc=false&start=2008 (3) The Texas Way of Urbanism (Report)– center for opportunity urbanism - http://opportunityurbanism.org/wp-content/uploads/2016/11/TheTexasWayOfUrbanismReport-6.pdf. (4) http://www.huliq.com/14166/texas-triangle-economic-engine-southwest
1,000,000.00 1,100,000.00 1,200,000.00 1,300,000.00 1,400,000.00 1,500,000.00 1,600,000.00 1,700,000.00 1,800,000.00 1,900,000.00 2008 2009 2010 2011 2012 2013 2014 2015 2016 2017 ($ millions)
Canada vs Texas GDP ($USD)
Canadian GDP Texas GDP
Legacy & Legacy West Home to newly relocated corporate headquarters: JP Morgan, FedEx, Toyota & Liberty Mutual
Pure Management Head Office PM
Downtown Dallas Las Colinas A B DFW Airport Telecom Corridor C D
* As at December 31, 2018.
Property Units Buildings Acres Amalfi Stonebriar 395 2 5.8 Avenue on Fairmount 368 1 3.7 Stoneleigh at Bear Creek 436 25 28.0 Fountainwood Apt 288 20 13.6 Vistas at Hackberry Creek 560 29 24.6 PURE at La Villita 306 15 11.9 Lansbrook at Twin Creeks 288 10 18.6 Prairie Creek Villas 464 45 38.6 The Preserve at Arbor Hills 330 13 15.3 PURE Farmers Market 340 3 7.1 Stoneleigh Valley Ranch 210 14 11.2 Totals 3,985 177 178.3
8 9 10 5 6 7 2 3 4 1 11
(1) As at March 31, 2019. (2) As at December 31, 2014. (3) For the first quarter of 2014. (4) For the first quarter of 2019.
Park 28, Phoenix, Arizona
Source: Bloomberg as at May 9, 2019. Note: Prior to the launch of the C$ ticker on July 2, 2014, the C$ values were calculated based on the US$ ticker converted at the daily spot exchange rate
. (1) Source: Bloomberg as at May 9, 2019 (2) Prior to the launch of the CAD$ ticker on July 2, 2014, the C$ values were calculated based on the USD$ ticker converted at the daily spot exchange rate
0.0% 1.0% 2.0% 3.0% 4.0% 5.0% 6.0% 7.0% 8.0% 9.0%
2014 2015 2016 2017 2018 Q1-19
SP Revenue SP NOI (Normalized for Property Management Fees) SP NOI (Actual)
(1) Data as per Pure Multi-Family financial results. Same Properties as compared to properties owned as of beginning of the previous year. Property Management was internalized October 1, 2017.
(1) As at March 31, 2018.
45% 50% 55% 60% 65%
400 600 800 1,000 1,200 1,400 2012 2013 2014 2015 2016 2017 2018 Q1-19
Debt GBV Debt/GBV 0.0% 0.5% 1.0% 1.5% 2.0% 2.5% 3.0% 3.5% 4.0% 4.5% 5.0% 0% 5% 10% 15% 20% 25% 30%
Maturity (%) Principal (%) Weighted Avg. Interest Rate
(1) For the month of March 2019. (2) As at March 31, 2019.
Avenue on Fairmount, Dallas, Texas
(1) Closing unit price on June 5, 2019. (2) Analyst Consensus estimates as at May 28 , 2019. (3) Financial Results as per March 31, 2019. (4) Adjusted to eliminate one-time costs associated with 2018 Strategic Review
PURE at La Villita, Dallas, Texas
sevans@puremultifamily.com
sadams@puremultifamily.com
sshillington@puremultifamily.com
agreig@puremultifamily.com
TSX
OTC QX
Property Location Acquisition Date Year of Construction Units Rentable Area (sf) Avg Unit Size (sf) # of Buildings Site Size (acres) Stoneleigh Valley Ranch DFW, TX 18-Jul-12 1999 210 208,136 991 13 11.2 Prairie Creek Villas DFW, TX 11-Oct-12 1997 464 464,082 1,000 45 38.6 Stoneleigh at Bear Creek DFW, TX 31-Oct-12 2004 436 419,325 962 25 28.0 Vistas at Hackberry Creek DFW, TX 6-Jun-13 1984 560 435,208 777 29 24.6 Fountainwood Apts DFW, TX 30-Aug-13 1986 288 228,900 795 20 13.6 The Preserve at Arbor Hills DFW, TX 28-Aug-14 1998 330 310,072 940 17 15.3 Amalfi Stonebriar DFW, TX 10-Aug-15 2014 395 320,163 811 2 5.8 Avenue on Fairmount DFW, TX 14-Sep-16 2015 368 304,950 829 1 3.7 Lansbrook at Twin Creeks DFW, TX 27-Jan-17 2002 288 276,708 961 9 18.6 PURE at La Villita DFW, TX 11-Jul-17 2007 306 281,010 918 15 11.9 PURE Farmers Market DFW, TX 2-Oct-17 2016 340 280,223 824 3 7.1 Totals & Weighted Averages 2005 3,985 3,528,777 886 179 178.3 The Boulevard at Deer Park Houston, TX 21-Jun-13 2000 216 201,804 934 9 12.2 Broadstone Walker Commons Houston, TX 27-Jun-14 2008 352 326,590 928 12 18.7 Totals & Weighted Averages 2005 568 528,394 930 21 30.9 Park at West Ave San Antonio, TX 7-May-15 2014 360 323,255 898 20 29.6 Brackenridge at Midtown San Antonio, TX 30-Sep-15 2014 282 240,205 852 9 9.6 PURE View at TPC San Antonio, TX 1-Mar-16 2014 416 392,192 943 13 19.4 PURE Estates at TPC San Antonio, TX 1-Mar-16 2007 344 390,592 1,135 45 34.8 Totals & Weighted Averages 2012 1,402 1,346,244 960 87 93.4 San Brisas Phoenix, AZ 28-Aug-14 & 1-Oct-13 1996 208 209,284 1,006 26 13.0 Park 28 Phoenix, AZ 9-Jun-17 2015 152 125,582 826 2 4.3 Pinnacle at Union Hills Phoenix, AZ 15-Jun-17 1996 264 269,128 1,019 16 14.1 PURE Fillmore Apartments Phoenix, AZ 29-Nov-17 2016 230 214,764 934 4 4.0 Totals & Weighted Averages 2006 854 818,758 959 48 35.4 PURE Creekside at Onion Creek Austin, TX 25-Jan-17 2016 276 228,514 828 10 13.6 Totals & Weighted Averages 2016 276 228,514 828 10 13.6 Portfolio Totals & Weighted Averages 2007 7,085 6,450,687 910 345 351.6
Source: Scotiabank, October 2018.
Photo: Broadstone Walker Commons, Houston TX