1
play

1 Purpose of the PigLame model Herd Pig Info Info To estimate - PDF document

Outline 1 . PigLam e m odel Background of the m odel Bayesian network The qualitative part of the m odel Case examples The quantitative part of the m odel Elicitation of probabilities Output variables Exam ple of use (


  1. Outline 1 . PigLam e m odel � Background of the m odel Bayesian network � The qualitative part of the m odel Case examples � The quantitative part of the m odel � Elicitation of probabilities � Output variables � Exam ple of use ( Esthauge) Advanced Herd Managem ent 2 . Mycoplasm a net October 2nd 2 00 7 � Background of the m odel � The m odel Tina Birk Jensen � Consequences of Mycoplasm a Background Background Causes of leg disorders Leg disorders in finishers: 1 . I nfectious Mycoplasma hyosynoviae, Erysipelothrix rhusiopathiae, Haemophilus parasuis, Streptococcus An economical problem for farmers due to: suis - Increased work load 2 . Environm ental - Cost of treatments - Reduced productivity Fracture, lesion to the claw wall, lesion to the claw sole - Risk of condemnations 3 . I nherited - A negative impact on animal welfare Osteochondrosis manifesta, osteochondrosis dissecans Control strategies against leg disorders will depend on the cause category
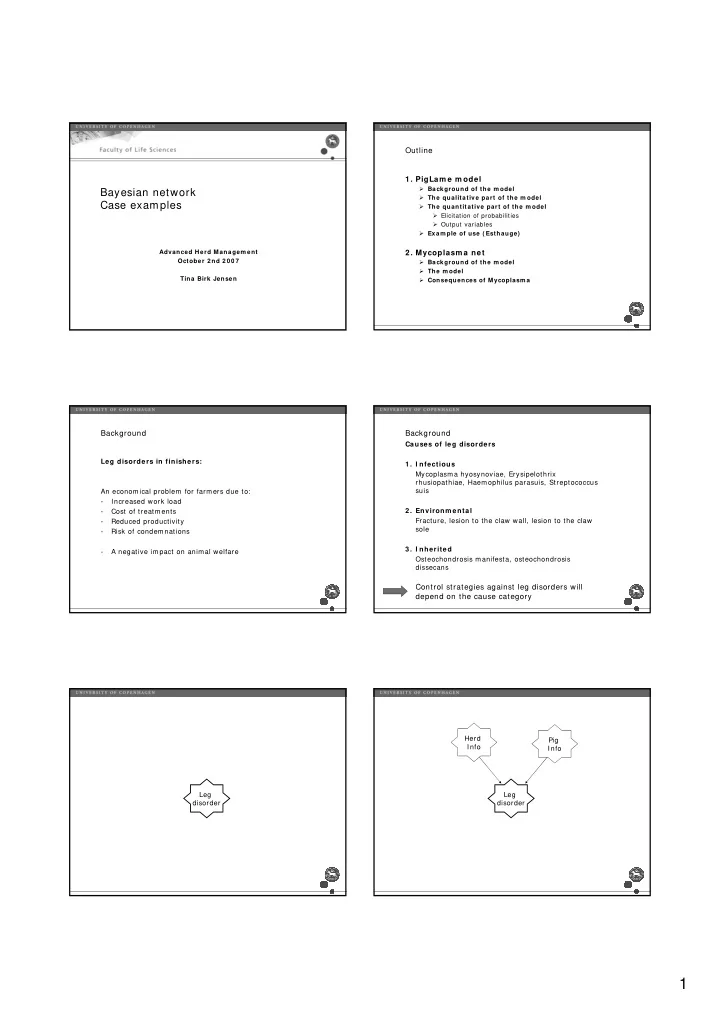
 Herd Pig Info Info Leg Leg disorder disorder 1

  2. Purpose of the PigLame model Herd Pig Info Info To estimate probability distributions of different manageable causes of leg disorders in finisher herds Leg disorder Strategy Strategy Strategy 1 2 3 PigLame model Bayesian network Bayesian Netw orks A • A set of variables and directed edges betw een variables • Each variable has a finite set of m utually exclusive B states • The variables and edges form a directed acyclic graph • To each variable A w ith parents B 1 ….B n , there is attached the probability table P( A| B 1 ,….,B n ) Bayes Theorem : ( ) ( ) ( ) | P B A P A = i i P A | B i + + + P ( B | A ) P ( A ) P ( B | A ) P ( A ) ... P ( B | A ) P ( A ) 1 1 2 2 n n Bayesian network Object-oriented Bayesian network The object diagram for the PigLam e m odel W hy use Bayesian Netw ork approach for the PigLam e m odel? Herd class Herd size • Static m odel Production Purchase Pen density Floor type • Express the biological variation and represent Straw uncertainty • I nform ation can flow in the opposite direction of the causality • Evidence about som e input variables can tell us som ething about variables that are not observable Pig class ”Hypothesis variables” Gender Disease Diagnostic test Lean meat percent 2

  3. Qualitative structure of the PigLame model Qualitative structure of the PigLame model • Tw o classes: Herd class and pig class • Background for the qualitative structure is based on evidence from published literature Environmental Infectious Inherited Feed strat Breed TailBite Arth_risk Gender LMP Pen Herd Produc- Floor Straw Purchase Weight den size tion Fracture Claw wall Claw sole Myco Strep Erysi Haemo OCM OCD Environmental Infectious Inherited PigLame Path1 Clinic1 Path2 Clinic2 Path3 Bac1 Path4 Bac2 Path5 Bac3 Path6 Bac4 Path7 Path8 Path9 ObsLame Pig class Herd class The quantitative part of the PigLame model The quantitative part of the model Probabilities elicited from the literature The probabilities in the model are based on: How to get the probabilities into the model Example: - Literature - Expert opinions Meat Percent OCM OCD 3

  4. The quantitative part of the model The quantitative part of the model Probabilities elicited from the literature Level Odds Ratio Probability P(OCM| 0 percent) OR 0 = 1.03 0 = 1 0.5 I ncrease in the LMP of one percentage point P(OCM| 1 percent) OR 1 = 1.03 1 = 1.03 0.507 OR= 1.03 ( OCM) P(OCM| 2 percent) OR 2 = 1.03 2 = 1.06 0.515 OR= 1.05 ( OCD) P(OCM| 3 percent) OR 3 = 1.03 3 = 1.09 0.522 ⎛ ⎞ Pno ⎜ ⎟ P(OCM| 4 percent) OR 4 = 1.03 4 = 1.13 0.530 ⎜ ⎟ OR − ⎝ 1 ⎠ pno P(OCM| 5 percent) OR 5 = 1.03 5 = 1.16 0.537 = Form ula: Pyes ⎛ ⎞ Pno + ⎜ ⎟ 1 OR ⎝ − ⎠ 1 Pno Level Odds Ratio Probability OR 0 = 1.05 0 = 1 P(OCD| 0 percent) 0.2 P(OCD| 1 percent) OR 1 = 1.05 1 = 1.05 0.208 Assum e: P(OCD| 2 percent) OR 2 = 1.05 2 = 1.10 0.216 P( OCM) = 0.5 P(OCD| 3 percent) OR 3 = 1.05 3 = 1.16 0.225 P( OCD) = 0.2 P(OCD| 4 percent) OR 4 = 1.05 4 = 1.22 0.234 P(OCD| 5 percent) OR 5 = 1.05 5 = 1.28 0.242 Exam ple: Exam ple: P( Fracture| fully slatted floors) P( Fracture| fully slatted floors) Consider 100 pigs examined individually at a herd visit. The herd has fully slatted floors in the pens. How often do you, during the examination expect to find a pig with a fracture? The quantitative part of the PigLame model Always (almost) 100 Exam ple: P( Fracture| fully slatted floors) 85 From the literature Usually 75 Consider 100 pigs examined individually Often • 46 conditional probabilities at a herd visit. The herd has fully slatted floors in the pens. From experts As often as not 50 How often do you, during the examination • > 150 conditional probabilities expect to find a pig with a fracture? Sometimes • 6 experts 25 • Not randomly distributed Once in a while 15 (Almost) never 0 4

  5. Environmental Infectious Inherited The quantitative part of the model The ”output” nodes TailBite Arth_risk Gender LMP • I nfectious, environm ental and inherited express the m agnitude of the cause-category at herd level Fracture Claw wall Claw sole Myco Strep Erysi Haemo OCM OCD Considered as a continuous variable • • Need to m ake a discretization of the node • Logit m ethod PigLame • The nodes have 1 0 states Path1 Clinic1 Path2 Clinic2 Path3 Bac1 Path4 Bac2 Path5 Bac3 Path6 Bac4 Path7 Path8 Path9 ObsLame Pig class The quantitative part of the model The quantitative part of the model The ”output” nodes The ”output” nodes Exam ple: ( 1 ) I nherited= Logit( P( OCM| I nherited) ) + 0 C ( 2) I nherited= Logit( P( OCD| I nherited) ) + C Inherited Then w e get: P( OCM| I nherited) = Logit -1 ( I nherited – 0C) ( 1’) OCM OCD ( 2’) P( OCD| I nherited) = Logit -1 ( I nherited – C) The quantitative part of the model The quantitative part of the model The ”output” nodes The ”output” nodes Assum e: P( OCM| 0.1 0.2 0.3 0.4 0.5 0.6 0.7 0.8 P( OCM| I nherited) = 0 .5 I nherited) P( OCD| I nherited) = 0.2 I nherited -2.20 -1.39 -0.85 -0.41 0 0.41 0.85 1.39 Then: ( 1’) P( OCM| I nherited) = Logit -1 ( I nherited – 0C ) = 0 .5 P( OCD| I nherited) = Logit -1 ( I nherited – C) = 0.2 ( 2’) P( OCD| 0.1 0.2 0.3 0.4 0.5 0.6 0.7 0.8 W hich gives: I nherited) C= - 1.39 I nherited 0.81 0 0.54 0.98 1.39 1.79 2.23 2.77 I nherited ( OCM) = 0 I nherited ( OCD) = 1.39 5

  6. Perspectives Mycoplasma net Outline � Background of the model • Probability distributions for the three cause- categories of leg disorders can serve as inputs � The model for future econom ic calculations � Consequences of Mycoplasma • First step in developing an econom ic m odel for leg disorders in finisher herds Literature: Otto, L. and Kristensen, C.S., 2 0 0 4 : A biological netw ork describing infection w ith Mycoplasm a hyopnem oniae in sw ine herds. Preventive Veterinary Medicine, 6 6 , 1 4 1 -1 6 1 . Mycoplasma hyopneumonia Mycoplasma net Purpose • Cause enzootic pneumonia in finishers To develop a tool for evaluating the economic • Important in the intensive pig production consequences of different control strategies against Mycoplasma • Can exist latent in the herd • Outbreak: 50-70 percent of the finishers have lung lesions • A well documented disease The decisions are often based on intuition from farmers, advisors and vets Risk factors Mycoplasma net Building the m odel: Disease level Biological m odel : - Based on biological knowledge Econom ic m odel : - Economic risk due to the biological variation Productivity Economics Constibution margin 6

  7. Risk factors Mycoplasma net I nput Control stragegy Risk factors: Diagnostics Disease level -Herd size -Production type -Purchase policy -Season -Region Productivity Economics Constibution margin Mycoplasma net Mycoplasma net I nput I nput Diagnostics: Control strategy: - Clinical examination (Any action with the aim to change the level of disease) - Serology examination - Postmortem examination Short term strategy: Medication Determines the disease level with more precision Vaccination Long term strategy: Change in mangement Change in production system Mycoplasma net Output: Probability distribution: - Disease level - Production outcome - Economical outcome 7

Download Presentation
Download Policy: The content available on the website is offered to you 'AS IS' for your personal information and use only. It cannot be commercialized, licensed, or distributed on other websites without prior consent from the author. To download a presentation, simply click this link. If you encounter any difficulties during the download process, it's possible that the publisher has removed the file from their server.

Recommend


More recommend