
SLIDE 1
1
Population genetics is based on statistical models: “A model is an intentional simplification of a complex situation designed to eliminate extraneous detail in order to focus attention
- n the essentials of the situation” (Daniel L. Hartl).
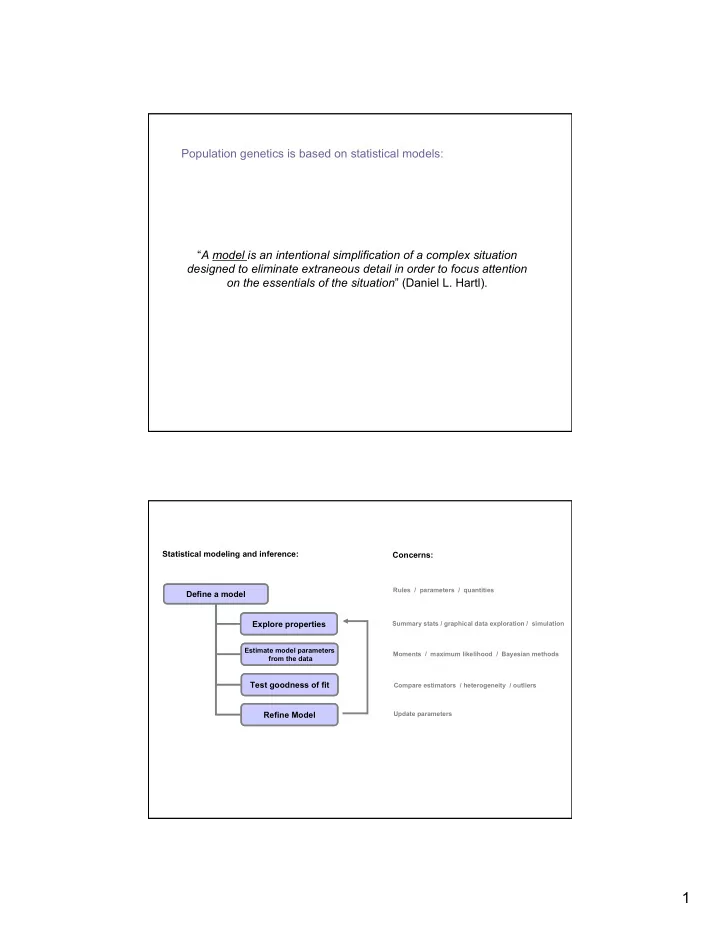
Define a model Explore properties
Estimate model parameters from the data
Test goodness of fit Refine Model Define a model Explore properties
Estimate model parameters from the data
Test goodness of fit Refine Model
Rules / parameters / quantities Summary stats / graphical data exploration / simulation Moments / maximum likelihood / Bayesian methods Compare estimators / heterogeneity / outliers Update parameters
Statistical modeling and inference: Concerns: