
SLIDE 1
1
Title of PowerPoint presentation
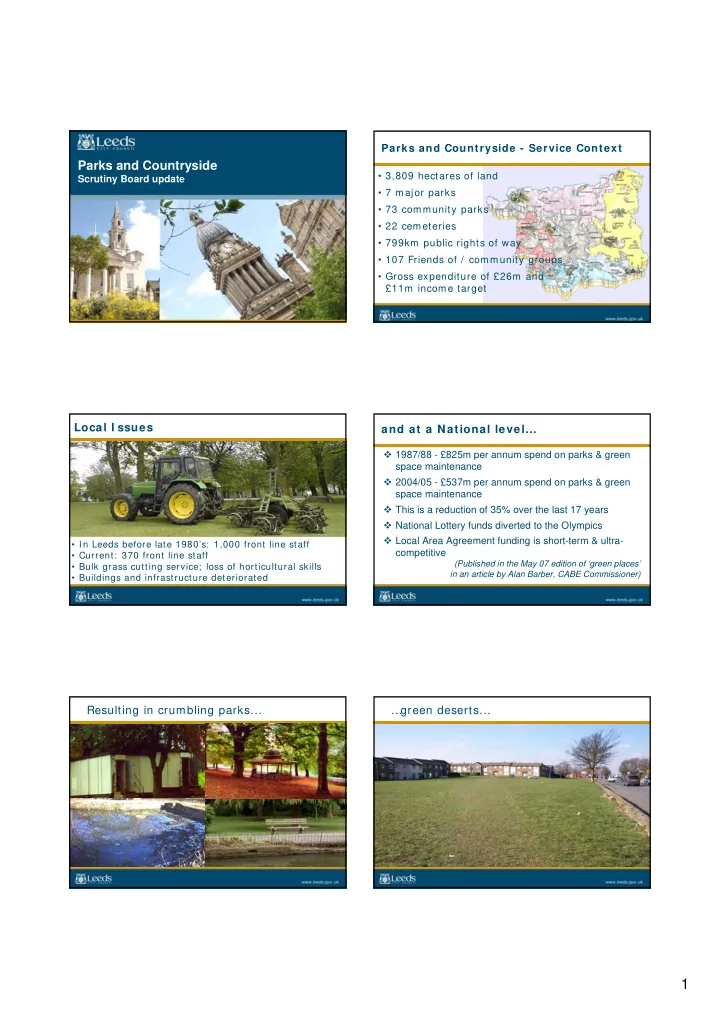
Parks and Countryside
Scrutiny Board update
Parks and Countryside - Service Context
- 3,809 hectares of land
- 7 major parks
- 73 community parks
- 22 cemeteries
- 799km public rights of way
- 107 Friends of / community groups
- Gross expenditure of £26m and
£11m income target
Local I ssues
- In Leeds before late 1980’s: 1,000 front line staff
- Current: 370 front line staff
- Bulk grass cutting service; loss of horticultural skills
- Buildings and infrastructure deteriorated
1987/88 - £825m per annum spend on parks & green space maintenance 2004/05 - £537m per annum spend on parks & green space maintenance This is a reduction of 35% over the last 17 years National Lottery funds diverted to the Olympics Local Area Agreement funding is short-term & ultra- competitive
(Published in the May 07 edition of ‘green places’ in an article by Alan Barber, CABE Commissioner)