
SLIDE 1
1
Poverty Mapping in the World Bank: Our Work and Lessons Learned
Qinghua Zhao Development Research Group The World Bank (202) 473-1273 Qzhao@worldbank.org
ch c ch ch
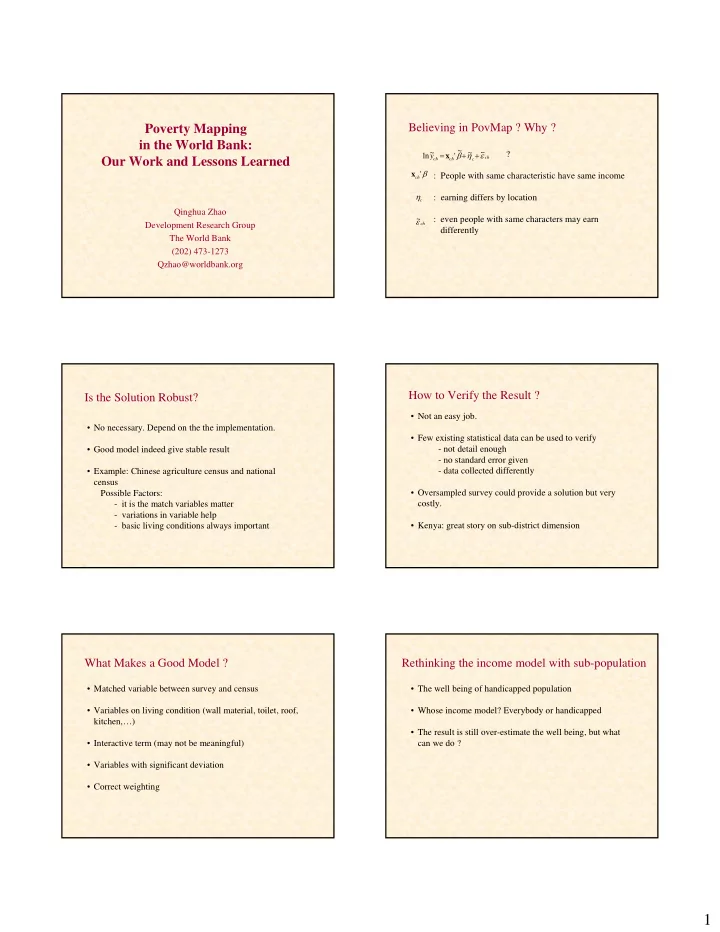
y ~ ~ ~ ' ~ ln x
Believing in PovMap ? Why ?
? : People with same characteristic have same income : earning differs by location : even people with same characters may earn differently
'
ch
x
c
ch
~
Is the Solution Robust?
- No necessary. Depend on the the implementation.
- Good model indeed give stable result
- Example: Chinese agriculture census and national
census Possible Factors:
- it is the match variables matter
- variations in variable help
- basic living conditions always important
How to Verify the Result ?
- Not an easy job.
- Few existing statistical data can be used to verify
- not detail enough
- no standard error given
- data collected differently
- Oversampled survey could provide a solution but very
costly.
- Kenya: great story on sub-district dimension
What Makes a Good Model ?
- Matched variable between survey and census
- Variables on living condition (wall material, toilet, roof,
kitchen,…)
- Interactive term (may not be meaningful)
- Variables with significant deviation
- Correct weighting
Rethinking the income model with sub-population
- The well being of handicapped population
- Whose income model? Everybody or handicapped
- The result is still over-estimate the well being, but what