1 2005 2012 Complaints Received 60,000 50,000 48,089 46,231 - - PDF document

1
SMART_READER_LITE
LIVE PREVIEW

1 2005 2012 Complaints Received 60,000 50,000 48,089 46,231 - - PDF document

Overview of Overview of Comprehensive Strategy Comprehensive Strategy Department of Public Safety, Division of for Juveni for Juvenile le Justi Justice Juvenile Justice When Schools and the Juvenile Justice System I ntersect Maxine


slide-1
SLIDE 1

1

Department of Public Safety, Division of Juvenile Justice

Maxine Evans-Armwood Central Area Administrator Court Services

When Schools and the Juvenile Justice System I ntersect

Overview of Overview of Comprehensive Strategy Comprehensive Strategy for Juveni for Juvenile le Justi Justice

Growing Up Up Lo Locke cked D Down: : Yo Youth in uth in Soli litary Co Conf nfin inement in in Ja Jail ils a and d Prisons Across t ross the U United S ed States ates (2012 r 12 repo port) rt) https

ttps://www. www.aclu.o .org/

WA WAKE C COUN UNTY SC SCHO HOOL SYSTE SYSTEM’S SC SCHO HOOL-TO-PR PRISON PI PIPEL PELINE Data ta sho shows tha that WCP WCPSS disc SS disciplines Bla Black stud k students the ha the hars rshest

http:/ ://www ww.t .thenubianmessage.c .com

  • m/2014/03/26

26/wak ake- e-co county-school

  • ol-syste

tems-sch chool

  • ol-to-
  • -pr

prison

  • n-pipel

eline/

Black stud students a and the d the ‘scho ‘school-to-prison pipe pipeline’ Last M May, J Jahbriel riel Morris an rris and seven ot ven other r students ts we were ar re arreste rested for for e events ts rel relating to to a wate ter ba ballo lloon f fight a at E Enlo loe Hig igh h Scho hool in Ra in Rale leigh, h, N.C. N.C. Ame America To Tonig night

http: ttp://america.aljazeer eera.co com/wa watc tch/shows/amer erica-tonight/amer erica-to tonight-blog/2014 2014/1/22/ 22/black-studen ents andthesch school

  • oltopri

prisonpi pipe peline.html

Re: Compla lain int t against t the Du Durham Pu Public lic School Di

  • ol District u

ct under er T Title tle VI of

  • f the

Civ Civil Right Rights Act Act o

  • f 1964

1964 a and Sect d Section 504 o 504 of the the Reha Rehabilitation Act Act o

  • f 1973

1973

http://www.leg egalaidnc.org/Public/lea earn/med edia_r _rel elea eases/20 2013 13_M _Med ediaRe Releases es/comp

  • mplaint

nt-a

  • against-t
  • the

he-d

  • dur

urha ham-p m-public- school-dis istric ict.pdf

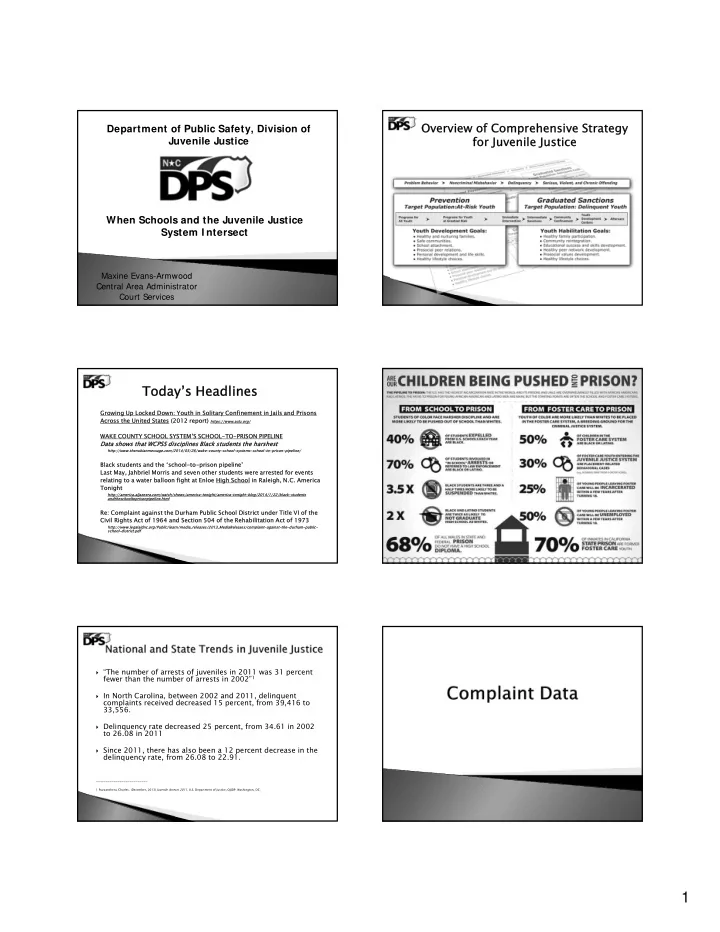
Toda Today’ y’s Headli s Headline nes

http://www-tc.pbs.org/wnet/tavissmiley/files/2013/01/EUA_STPPgraphic.jpg  “The number of arrests of juveniles in 2011 was 31 percent

fewer than the number of arrests in 2002”1

 In North Carolina, between 2002 and 2011, delinquent

complaints received decreased 15 percent, from 39,416 to 33,556.

 Delinquency rate decreased 25 percent, from 34.61 in 2002

to 26.08 in 2011

 Since 2011, there has also been a 12 percent decrease in the

delinquency rate, from 26.08 to 22.91.

__________________________

1 Puzzanchera, Charles. (December, 2013) Juvenile Arrests 2011. U.S. Department of Justice, OJJDP: Washington, DC.

slide-2
SLIDE 2

2

45,389 48,089 46,231 43,797 40,432 37,584 37,159 34,769 10,000 20,000 30,000 40,000 50,000 60,000 2005 2006 2007 2008 2009 2010 2011 2012 2005‐2012 Complaints Received 5000 10000 15000 20000 25000 30000 35000 40000 45000 50000 2005 2006 2007 2008 2009 2010 2011 2012 40,633 42,920 41,487 38,901 35,801 33,299 33,556 31,575 4,756 5,169 4,744 4,896 4,631 4,285 3,603 3,194 2005‐2012 Juvenile Delinquent and Status Complaints Delinquent Complaints Status Complaints

Delinquent Delinquent and Undiscipli nd Undisciplined Complai ned Complaints

Class A‐E, 814 (2.3%) Class F‐I, A1, 7,597 (21.8%) Class 1‐3, 23,053 (66.3%) Infraction, 111 (0.3%) Status, 3,194 (9.2%) Complaints Received 2012 Class A‐E Class F‐I, A1 Class 1‐3 Infraction Status

Compla Complaints by Clas ints by Class

Race/Ethnicity Class A-E Class F-I, A1 Class 1-3 Infraction Status Complaint s % By % By Ra Race ce American Indian or Alaska Native 36 89 359 55 539 2% 2% Asian 1 21 100 11 133 0.4% 0.4% Black or African- American 409 4,216 12,013 33 999 17,670 51% 51% Hispanic/Latino 86 698 2,036 11 330 3,161 9% 9% Native Hawaiian or Other Pacific Islander 9 31 4 44 0.1% 0.1% Two or More Races 11 180 525 3 75 794 2% 2% Unknown 1 28 7 36 0.1% 0.1% White 271 2,383 7,961 64 1,713 12,392 36% 36% Total 814 7,597 23,053 111 3,194 34,769 100% 100%

G.S.N. Charged Delinquent Offense Delinquent Complaints 14‐33(a) Simple assault 3,659 14‐72(a) Larceny ‐ Misdemeanor 2,769 14‐33(a) Simple affray 1,702 14‐288.4(a)(6) Disorderly Conduct at School 1,520 14‐54(a) Breaking and or entering (f) 1,308 14‐127 Injury to real property 1,148 14‐277.1 Communicating threats 1,122 14‐223 Resisting public officer 857 14‐269.2 Weapons on educational property / aid (m) 771 14‐56 Break or enter a motor vehicle 768 14‐71.1 Possess stolen goods / property (m) 766 14‐72(b)(2) Larceny after breaking or entering 765 14‐160 Injury to personal property 759 14‐33(c)(4) Assault government official / employee 684 90‐95(a)(3) Simple possession schedule VI controlled substance 663 14‐72.1 Shoplifting concealment goods 633 90‐113.22 Possess drug paraphernalia 629 90‐95(a)(3) Possess marijuana up to 1/2 oz 618 14‐160(b) Injury to Personal Property in excess $200 607 14‐54(b) Breaking or entering (m) 453 14‐269.2(d) Possess or carry,openly or concealed,any BB/stungun,air rifle/pistol,bowie knife,dirk,dagger,slingshot,leaded cane,switchblade knife,blackjack,metal knuckles,razors/razorblades(except for personal shaving),firework,or any sharp;pointed/edged instrument except education supplies,unaltered nailfiles,clips/tools(used for preparing food,instruction,maintenance)on educational property 444 14‐72(a) Larceny ‐ Felony 426 14‐27.5A Sexual battery 364 14‐159.13 Second degree trespass 338 14‐71.1 Felony Possession of Stolen Property 326 Total 24,099

slide-3
SLIDE 3

3

19,359 (55.7%) 15,410 (44.3%) School‐Based vs Non School‐Based Complaints: CY 2012 Non School‐Based School‐Based 18,262 16,711 16,563 16,140 16,118 15,410 27,960 26,092 23,879 21,444 21,041 19,359 5,000 10,000 15,000 20,000 25,000 30,000 2007 2008 2009 2010 2011 2012 School‐Based vs Non School‐Based Complaints Trend: 2007 to 2012 School‐Based Not School‐Based

Detention A tention Admissions/Juveniles ssions/Juveniles

5,142 5,484 5,037 4,995 4,590 4,443 3,818 2,972 2,591 2,210 2,344 2,173 2,085 1,988 1,907 1,419 1,062 836 1,000 2,000 3,000 4,000 5,000 6,000 2005 2006 2007 2008 2009 2010 2011 2012 2013

CY 2 2005 05 - 2013: D 013: Detentio ion A n Admiss missio ions ns

Youth of Color White Youth

slide-4
SLIDE 4

4

2012 Juvenile Detention Admissions by Race/Ethnicity Race/Ethnicity Total Percentage American Indian or Alaska Native 71 1.76% Asian 11 0.27% Black or African‐American 2,409 59.69% Hispanic/Latino 344 8.52% Native Hawaiian or Other Pacific Islander 9 0.22% Two or More Races 126 3.12% Unknown 2 0.05% White 1,064 26.36% Total 4,036 100.00%

Detentio Detention Admissio Admission by by Ra Race/Ethnicity ty

5,142 5,484 5,037 4,995 4,590 4,443 3,818 2,972 2,591 2,210 2,344 2,173 2,085 1,988 1,907 1,419 1,062 836 1,000 2,000 3,000 4,000 5,000 6,000 2005 2006 2007 2008 2009 2010 2011 2012 2013

CY 2 2005 05 - 2013: D 013: Detentio ion A n Admiss missio ions ns

Youth of Color White Youth 70% 70% 70% 71% 70% 70% 73% 74% 76% 30% 30% 30% 29% 30% 30% 27% 26% 24% 0% 10% 20% 30% 40% 50% 60% 70% 80% 2005 2006 2007 2008 2009 2010 2011 2012 2013

CY 2 2005 05 - 2013: D 013: Detentio ion A n Admiss missio ions ns

Youth of Color White Youth 21% 79% Juvenile Detention Admissions by Gender in 2012 (n=4,036) Female Male

Detention Admissions by Detention Admissions by Gender Gender YDC Commitment YDC Commitment Rate Rate

slide-5
SLIDE 5

5

YDC Commitments YDC Commitments YDC Commitments by Offense Type YDC Commitments by Offense YDC Commitments by Offense Class Class

slide-6
SLIDE 6

6

 According to the Office of Juvenile

Justice and Delinquency Prevention:

Disproportionate Minority Contact (DMC) refers to the disproportionate number of minority youth who come into contact with the juvenile justice system.

http://ojjdp.gov/ojstatbb/dmcdb/asp/whatis.asp

 A research project  Solving the problems of racism or poverty  The Blame Game – kids, parents, the community,

music videos, television, the media, “the system”

 Finger-pointing at public officials  The Abuse Excuse – poor, broken home, bad

neighborhood, etc.

 Slap on the wrist for African-American/Hispanic

youth

 Structural inequalities in our society  Differential offending rates  Police responses to crime  Locations of offenses  Conscious or unconscious use of racial/ethnic

stereotypes

 Failure to use data to drive decisions  Failure to include all stakeholders in policy decisions

 Where do DMC indicators appear?

  • School suspensions
  • Complaints from Schools and SRO
  • Complaint rates from law enforcement and other

community sources

  • Decision to divert or file petition to court
  • Rates of secure detention
  • Rates of commitment to YDC
  • Rates of referral to community based services,

including treatment

  • Educate community, law enforcement, key

stakeholders

  • Engage the community and stakeholders
  • Must include Workforce Representatives and

Consumers

  • Need to ensure Cultural Competency & Sensitivity
  • May need to make change in policy, procedure and

decision-making framework; paradigm shift

  • Agencies must critically review policies and

procedures

  • Be data-driven; Must use your data

 Critical Decision Points  Relative Rate Index (RRI)  DMC County Maps

slide-7
SLIDE 7

7

RRI is a means of comparing the rates of juvenile justice contact experienced by different groups

  • f youth.

http://ojjdp.gov/ojstatbb/dmcdb/asp/whatis.asp

 State DMC Coordinator  Educating Staff, Community Stakeholders and Our

Partners

 Reviewing Court Services Critical Decision Making

Points

 Strategic Planning for High Risk/High Needs Children  Moving to Intensive Case Management  Providing Specialized Training for Court Counselors

 DPS/JJ County Databook

http://www.ncdps.gov/Index2.cfm?a=000003,002476,002483,002482,00 2506,002523

 DPS Facilities Strategic Plan

http://www.ncdps.gov/div/JJ/JJ%20Facilities%20Strategic%20Plan%2004101 4%20FINAL.pdf

 Center for Safer Schools

https://www.ncdps.gov/Index2.cfm?a=000003,002476,002689

 Connecticut DMC Video

http://www.youtube.com/watch?v=ArPuTG_X4dg

slide-8
SLIDE 8

8

Overview of Comprehensive Strategy for Juvenile Justice

Questions?

Maxine ne E Evans ns-A

  • Armwoo

wood Central Area Administrator 3010 Hammond Business Pl, Room 110 4212 MSC Raleigh, NC 27603 (919) 324-6406 maxine.evans.armwood@ncdps.gov