
SLIDE 1
17 April 2018
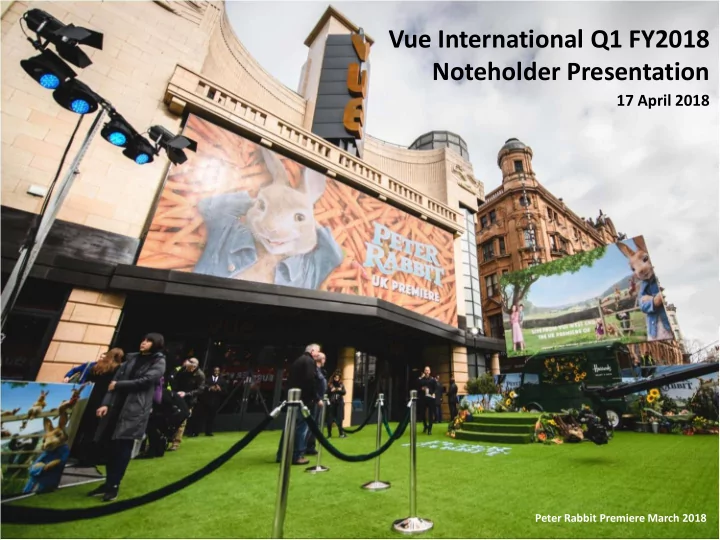
Vue International Q1 FY2018 Noteholder Presentation
Peter Rabbit Premiere March 2018
Vue International Q1 FY2018 Noteholder Presentation 17 April 2018 - - PowerPoint PPT Presentation
Vue International Q1 FY2018 Noteholder Presentation 17 April 2018 Peter Rabbit Premiere March 2018 Important Information IMPORTANT: You must read the following before continuing PRESENTATION OF FINANCIAL DATA On 12 August 2016 Vougeot Bidco
17 April 2018
Peter Rabbit Premiere March 2018
2
IMPORTANT: You must read the following before continuing
PRESENTATION OF FINANCIAL DATA On 12 August 2016 Vougeot Bidco plc changed its name to Vue International Bidco plc. This presentation refers to market information obtained from third party sources. “Market Admissions” for UK, Italy and the Netherlands are a measure of paid and unpaid box office admissions and are sourced from the Cinema Advertising Association (“CAA”), Cinetel and Rentrak respectively. Market Admissions for Germany and Poland includes only paid admissions and the sources are Rentrak through www.IBOE.com and www.boxoffice.pl respectively. Gross Box Office Revenue (“GBOR”) measures box office revenue including local sales taxes by film and in aggregate. Market GBOR refers to total GBOR for markets referred to. “Major Territories” and “Vue Major Territories” specifically refer to UK, Germany, Poland, Italy and the Netherlands being the major markets in which Bidco
a proportion of Major Territories Total Market GBOR. Market and Vue GBOR information for UK & Ireland, Germany and the Netherlands is sourced from Rentrak through www.IBOE.com, Poland from www.boxoffice.pl and Italy from Cinetel. The Pro Forma financial information presented in this report has been derived from the consolidated financial statements of Bidco, and the pre-acquisition consolidated financial information of Tulip UK NewCo Limited and its subsidiaries which includes Vue Nederland B.V. (together “VNL”), adjusted to give pro forma effect to the €120m Term Loan B which was issued in July 2016, and the application of the proceeds therefrom. The Pro Forma financial information also includes the Pro Forma savings resulting from the strategic decision made by the board of directors of the Company to purchase certain contractual digital equipment related to the projection of 3D Films. This decision will result in significant savings in costs and an associated increase in consolidated EBITDA. The Company currently has license arrangements on rolling 5 year terms and where such licenses have terminated or will terminate within the next 24 months the Company has added back the associated cost savings in arriving at Consolidated EBITDA. At 28 February 2018 the increase in Consolidated LTM EBITDA resulting from this reduction in administration expenses is £5.1m comprising £3.1m of actual savings already achieved and £2.0m of annualised pro forma savings which will be achieved on licenses expiring in the next 24 months. Effective from 28th November 2014, the Company has elected to adopt International Financial Reporting Standards (“IFRS”). All financial information in this presentation has been prepared in accordance with IFRS. A summary of the financial information on the Pro Forma basis and the Bidco “As Acquired” basis is set out in the Appendices. A reconciliation between the Bidco As Acquired Profit and Loss Account and the audited Statutory Consolidated Profit and Loss Account for Vue International Bidco plc is also provided within the Appendices. DISCLAIMER This presentation is for information purposes only and does not constitute an offer to sell or the solicitation of an offer to buy securities. This presentation does not contain all of the information that is material to an investor. Forward-Looking Statements This presentation contains “forward-looking statements” as that term is defined by the U.S. federal securities laws and within the meaning of the securities laws of certain other jurisdictions. These forward-looking statements include, without limitation, those regarding our intentions, beliefs or current expectations concerning our future financial condition and performance, results of operations and liquidity; our strategy, plans, objectives, prospects, growth, goals and targets; future developments in the markets in which we participate or are seeking to participate; and anticipated regulatory changes in the industry in which we operate. These statements often include words such as “anticipate,” “believe,” “could,” “estimates,” “expect,” “forecast,” “intend,” “August,” “plan,” “projects,” “should,” “suggests,” “targets,” “would,” “will,” and other similar expressions. These statements are not guarantees of performance or results. Many factors could affect our actual financial results or results of operations and could cause actual results to differ materially from those expressed in the forward-looking statements and projections. We undertake no obligation to review or confirm analysts’ expectations or estimates or to release publicly any revisions to any forward-looking statements to reflect events or circumstances after the date of this presentation. Vue International Bidco plc and its shareholders continue to evaluate all of the strategic options and opportunities available. This includes a potential sale or IPO, however no decisions have been made and nothing has been ruled out.
Important Information
3
Agenda and Today’s Speakers
Tim Richards CEO Alison Cornwell CFO
Key Financials Market Update Highlights Q1 2018 Current Trading Update and Outlook Summary Q&A
Steve Knibbs COO
4
` Turnover (£m) 246.3 236.6 4.1% 1.6% Consolidated EBITDA (£m) 55.5 56.3 (1.4)% (4.3)% Consolidated EBITDA % 22.5% 23.8% (1.3)ppt (1.4)ppt Admissions (m) 25.3 24.6 2.9% 2.9% ATP (£) 6.32 6.31 0.1% (2.3)% SPP (£) 2.30 2.16 6.4% 3.7% LTM EBITDA (£m) 125.1 Net Leverage 4.9x Variance Q1 2017 Q1 2018 (also 4.9x in constant currency) Constant C. (£125.7m in constant currency) As Reported
highest group admissions ever
Poland
selective pricing initiatives and the mix impact of admissions growth in lower ATP territories such as Poland
and continued investment in concessions
Poznań Stary Browar in Poland and Den Bosch in the Netherlands
Highlights Q1 2018
5
Market Performance – UK & Ireland
The Last Jedi, compared to it’s spin off predecessor Rogue One: A Star Wars Story
which featured both Sing and The LEGO Batman Movie
Three Billboards Outside Ebbing, Missouri (£12.6m)
(m) (£m) 46.9 49.9 YTD 2017 YTD 2018 46.9 49.9 Q1 2017 Q1 2018
Admissions (UK only)
351 383 YTD 2017 YTD 2018 351 383 Q1 2017 Q1 2018
GBOR (UK only)
6.5% 6.5% 9.1% 9.1% Source: DCM for admissions, IBOE / Rentak for GBOR Top Titles Q1 2018 - UK & Ireland GBOR (£m) 3D Local Star Wars: The Last Jedi 82.4 Yes No Jumanji: Welcome To The Jungle 37.3 Yes No Greatest Showman, The 33.7 No No Black Panther 30.9 Yes No Darkest Hour 23.0 No Yes Total Top 5 207.3 3 1 Other 203.7 Total Market 411.0 Top 5 as a % of total market 50.4% Top Titles Q1 2017 - UK & Ireland GBOR (£m) 3D Local Rogue One: A Star Wars Story 66.0 Yes No Fantastic Beasts And Where To Find Them 33.4 Yes No La La Land 28.8 No No Sing 25.1 Yes No The LEGO Batman Movie 20.2 Yes No Total Top 5 173.4 4 Other 204.1 Total Market 377.5 Top 5 as a % of total market 45.9%
6
Market Performance – Germany
(€16.3m) and Die kleine Hexe (€7.1m)
(m) (€m) 34.2 31.4 YTD 2017 YTD 2018 34.2 31.4 Q1 2017 Q1 2018
Admissions
297 281 YTD 2017 YTD 2018 297 281 Q1 2017 Q1 2018
GBOR
(8.4)% (8.4)% (5.4)% (5.4)% Source: IBOE / Rentrak Top Titles Q1 2018 - Germany GBOR (€m) 3D Local Star Wars: The Last Jedi 68.4 Yes No Fifty Shades Freed 21.3 No No Jumanji: Welcome to the Jungle 18.6 Yes No Dieses bescheuerte Herz 16.3 No Yes Coco 9.9 Yes No Total Top 5 134.5 3 1 Other 146.4 Total Market 280.9 Top 5 as a % of total market 47.9% Top Titles Q1 2017 - Germany GBOR (€m) 3D Local Rogue One: A Star Wars Story 43.6 Yes No Fifty Shades Darker 22.9 No No Sing 18.5 Yes No Fantastic Beasts And Where To Find Them 16.0 Yes No Moana 15.2 Yes No Total Top 5 116.3 4 Other 180.8 Total Market 297.1 Top 5 as a % of total market 39.1%
7
Market Performance – Poland
contributing 47% of top 5 GBOR
14.6m), Ferdinand (PLN 13.9m), Listy Do M. 3 (PN 13.5m), Paddington 2 (PLN 12.5m) and Jumanji: Welcome To The Jungle (PLN 12.0m)
319 348 Q1 2017 Q1 2018 (m) (PLNm) 17.0 18.8 YTD 2017 YTD 2018 17.0 18.8 Q1 2017 Q1 2018
Admissions
319 348 YTD 2017 YTD 2018
GBOR
10.6% 10.6% 9.1% 9.1% Source: Boxoffice.pl Top Titles Q1 2018 - Poland GBOR (Złm) 3D Local Star Wars: The Last Jedi 45.8 Yes No Fifty Shades Freed 26.2 No No Narzeczony Na Niby 22.5 No Yes Kobiety Mafii 20.5 No Yes Podatek Od Milosci 19.7 No Yes Total Top 5 134.7 1 3 Other 213.8 Total Market 348.5 Top 5 as a % of total market 38.6% Top Titles Q1 2017 - Poland GBOR (Złm) 3D Local Rogue One: A Star Wars Story 34.3 Yes No Sing 29.5 Yes No Sztuka Kochania. Historia Michaliny Wislockiej 29.4 No Yes Fifty Shades Darker 26.0 No No
19.2 No Yes Total Top 5 138.3 2 2 Other 181.1 Total Market 319.4 Top 5 as a % of total market 43.3%
8
Market Performance – Italy
titles outside the top 10
the Cinema2Day campaign and lower kids mix
Tangenziale (€9.5m), Benedetta Follia (€8.5m), A Casa Tutti Bene (€7.0m) and Poveri Ma Ricchissimi (€6.1m)
(m) (€m) 35.4 32.9 YTD 2017 YTD 2018 35.4 32.9 Q1 2017 Q1 2018
Admissions
216 217 YTD 2017 YTD 2018 216 217 Q1 2017 Q1 2018
GBOR
(7.0)% (7.0)% 0.4% 0.4% Source: Cinetel Top Titles Q1 2018 - Italy GBOR (€m) 3D Local Star Wars: The Last Jedi 15.1 Yes No Murder On The Orient Express 14.3 No No Fifty Shades Freed 13.9 No No Wonder 12.1 No No Coco 11.2 Yes No Total Top 5 66.6 2 Other 150.6 Total Market 217.2 Top 5 as a % of total market 30.7% Top Titles Q1 2017 - Italy GBOR (€m) 3D Local Moana 14.3 Yes No Fifty Shades Darker 14.3 No No L'Ora Legale 10.2 No Yes Rogue One: A Star Wars Story 10.2 Yes No Mister Felicità 10.1 No Yes Total Top 5 59.1 2 2 Other 157.3 Total Market 216.3 Top 5 as a % of total market 27.3%
9
Market Performance – Netherlands
included Sing, Moana and The LEGO Batman Movie
Murder On The Orient Express (€2.5m)
(m) (€m) 10.7 9.7 YTD 2017 YTD 2018 10.7 9.7 Q1 2017 Q1 2018
Admissions
91 85 YTD 2017 YTD 2018 91 85 Q1 2017 Q1 2018
GBOR
(9.3)% (9.3)% (6.0)% (6.0)% Source: Cinetel Top Titles Q1 2018 - Netherlands GBOR (€m) 3D Local Star Wars: The Last Jedi 10.9 Yes No Jumanji: Welcome to the Jungle 7.2 Yes No Ferdinand 5.5 Yes No Coco 5.0 Yes No Black Panther 4.4 Yes No Total Top 5 33.0 5 Other 52.5 Total Market 85.5 Top 5 as a % of total market 38.6% Top Titles Q1 2017 - Netherlands GBOR (€m) 3D Local Sing 8.1 Yes No Soof 2 7.5 No Yes Rogue One - A Star Wars Story 7.5 Yes No Fantastic Beasts & Where To Find Them 5.7 Yes No Fifty Shades Darker 4.6 No No Total Top 5 33.4 3 1 Other 57.5 Total Market 90.9 Top 5 as a % of total market 36.7%
10
UK Market GBOR (£m) 383.1 351.3 9.1% 9.1% Germany Market GBOR (£m) 248.3 253.7 (2.1)% (5.4)% Poland Market GBOR (£m) 73.9 62.7 17.9% 9.1% Italy Market GBOR (£m) 191.9 184.7 3.9% 0.4% Netherlands Market GBOR (£m) 75.5 77.6 (2.7)% (6.0)% Major Territories Total Market GBOR (£m) 972.7 929.9 4.6% 2.1% Vue Major Territories GBOR (£m) 170.9 165.7 3.1% 0.6% Vue Major Territories GBOR Market Share (%) 17.6% 17.8% (0.3)ppt (0.3)ppt Constant C. Q1 2018 Q1 2017 Variance As Reported
Market GBOR Share Summary
–
The closure of the Wroclaw Arkady site in July 2017 combined with disruption from major site refurbishments and growth in the overall market estate in Poland
–
A higher proportion of art-house and award titles across several territories which is favoured by independent cinemas including Darkest Hour, The Shape of Water and Three Billboards Outside Ebbing, Missouri
11
Initiatives and Developments in Q1 2018
the Kingdom of Saudi Arabia
Edinburgh
Purmerend and Doetinchem
Browar in Poland and Den Bosch in the Netherlands
roll-outs planned during the year
and scheduling systems including completion of the roll out
Den Bosch Re-Opening Poznań Stary Browar
12
Box Office Revenue (£m) 160.0 155.5 2.9% 0.5% Concessions Revenue (£m) 58.3 53.2 9.5% 6.7% Screen Advertising and Other Revenue (£m) 28.0 27.9 0.5% (2.3)% Group Turnover (£m) 246.3 236.6 4.1% 1.6% Admissions (m) 25.3 24.6 2.9% 2.9% ATP (£) 6.32 6.31 0.1% (2.3)% SPP (£) 2.30 2.16 6.4% 3.7% Total Revenue per Person (£) 9.72 9.61 1.2% (1.3)% Q1 2018 Q1 2017 Variance As Reported Constant C.
Financial Information – Turnover
and Poland
and strong admissions growth in Poland which is has a low ATP relative to other territories
products, initiatives and merchandise income
and Italy
13
Financial Information – Margin and Costs
taxes due to lower rebates and higher rates, £0.9m relating to new sites, and £0.7m increased staff costs reflecting inflationary wage increases and higher staffing levels attributable to higher admissions
and acquisition of Manchester Printworks, offset by regear savings
Turnover (£m) 246.3 236.6 4.1% 1.6% Gross profit (£m) 154.0 148.0 4.0% 1.5% Gross profit % 62.5% 62.6% (0.0)ppt (0.1)ppt Administrative expenses (£m) (63.8) (58.7) (8.7)% (6.2)% Administrative expenses as % of revenue 25.9% 24.8% (1.1)ppt (1.1)ppt Rent (£m) (34.8) (33.0) (5.2)% (3.0)% Rent as % of revenue 14.1% 14.0% (0.1)ppt (0.2)ppt Consolidated EBITDA (£m) 55.5 56.3 (1.4)% (4.3)% Consolidated EBITDA % 22.5% 23.8% (1.3)ppt (1.4)ppt Constant C. Q1 2018 Q1 2017 Variance As Reported
14
Financial Information – Cashflow and Net Debt Movement
Q1 2018 Q1 2017 2018 YTD 2017 YTD
Consolidated EBITDA (£m) 55.5 56.3 55.5 56.3 Working Capital (Trade) 0.2 8.2 0.2 8.2 Working Capital (Non Trade) (0.8) (1.2) (0.8) (1.2) Net Capital Expenditure (8.1) (6.7) (8.1) (6.7) Tax Paid (1.6) (0.8) (1.6) (0.8) Other (Including Non-Cash Adjustments) (4.7) (3.7) (4.7) (3.7)
Operating Cash Flow (£m) 40.6 52.1 40.6 52.1
Interest Costs (18.2) (18.6) (18.2) (18.6) Total Cash Flow Excluding Debt (£m)
22.4 33.5 22.4 33.5
Non Cash Movements in Net Debt: Unrealised FX gain/(loss) on Euro Bonds and Term Loan B (0.9) 1.0 (0.9) 1.0 Unrealised FX gain/(loss) on cash, other loans and finance leases 0.1 (2.5) 0.1 (2.5) Movement in balance of capitalised financing fees on RCF (0.1) (0.1) (0.1) (0.1) Amortised Cost Adjustment on Bond and Term Loan B (1.0) (1.0) (1.0) (1.0) Other
Dec/(inc) in Net Debt (per Leverage Definition) (£m) 20.5 28.9 20.5 28.9
15
Financial Information – Capital Structure and Leverage Development
Q1 2018 Q4 2017 £300m Sterling Fixed Rate Notes (Net of Unamortised Financing Costs) 296.5 296.2 €360m Euro Floating Rate Notes (Net of Unamortised Financing Costs) 311.9 310.6 €120m Euro Term Loan B (Net of Unamortised Financing Costs) 104.0 103.6 Revolving Credit Facility
32.4 34.0 Unamortised Financing Fees on RCF (0.4) (0.5) Total External Debt Net of Fees (£m) 744.3 743.9 Cash 137.0 116.1 Restricted Cash (4.2) (4.2) Unrestricted Cash and Cash Equivalents (£m) 132.8 111.9 Total External Net Debt (£m) 611.5 632.0 Gross Leverage (x) 6.0x 5.9x Net Leverage (x) 4.9x 5.0x LTM Pro Forma Consolidated EBITDA (£m) 125.1 126.0 Net Leverage (x) constant currency 4.9x 4.9x LTM Pro Forma Consolidated EBITDA (£m) constant currency 125.7 128.1
16
Current Trading Update and Outlook
Q2 trading to date underpinned by animated adaptation of Beatrix Potter's classic Peter Rabbit and the record breaking Black Panther against a backdrop of a strong prior year, which featured Beauty and the Beast; the 9th highest grossing UK box office title of all time
UK & Ireland Market
German Market
Poland Market
Italian Market
Netherlands Market
Other key titles and future releases
2 and Solo: A Star Wars Story
(1) Admissions for the UK only
17
Summary
refurbishments also underway, new screens and technology initiatives
Deadpool 2 and Solo: A Star Wars Story
18
Further questions can be addressed to investor.relations@vuemail.com Vueinternational@brunswickgroup.com Provisional Dates: Q2 2018 Investor Call 24 July 2018 1.00pm
Q&A
19
20
As at 28 February 2018 UK & Ireland Germany & Denmark Poland & Baltics (1) Italy Netherlands Taiwan Group Sites
87 33 34 36 21 1 212
Multiplex % (2)
98.9% 97.0% 94.1% 100.0% 76.2% 100.0% 95.8%
Screens
842 289 273 362 118 20 1,904
% screens with stadium seating
96.2% 99.7% 100.0% 99.4% 84.7% 100.0% 97.2%
Vue At A Glance As At 28 February 2018
(1) Baltics consists of our operations in Latvia and Lithuania (2) Multiplex cinema site defined as a site with five or more screens Source Company Data
Dublin Inverness Aberdeen Glasgow Edinburgh London Cardiff Birmingham Manchester Aarhus Odense Copenhagen Berlin Magdeburg Halle Dresden Regensburg Augsburg Munich Kiel Wolfsburg Hamburg Oldenburg Bremen Mulheim Essen Krefeld Wuppertal Trier Offenbach Stuttgart Heilbronn Sindelfingen Freiburg
Germany Denmark
Gottingen Wurzburg Hannover Bielefeld Elbląg Gdańsk Sopot Gdynia Rumia Słupsk Koszalin Szczecìn Bydgoszcz Poznań
Poland
Wloclawek Lódź Radom Warsaw Kielce Rzeszów Kraków Rybnik Zabrze Wrocław Zgorzelec Tychy Czechowice Lublin Katowice Olsztyn Cagliari Cagliari Sestu Catania Catanzaro Lamezia Surbo Bari Salerno Nola Napoli Montesilvano Magliana Moderno Guidonia Terni Perugia Novoli Bologna Grosseto Livorno Parma Parma Campus Genova Beinasco Rozzano Torino Cerro Vimercate Odeon Trieste Udine Treviso Padova Vicenza Verona Montabello
Steenwijk Hoorn Heerhugowaard AlkmaarAmsterdam
Purmerend Hilversum Deventer Apeldoorn Amersfoort Arnhem Doetinchem Nijmegen Alphen aan den Rijn Vlaardingen Gorinchem Den Bosch Eindhoven Kerkrade 21
Definitions
Definitions
Lithuania), Italy and the Netherlands
Taiwan
Currency Rates
Market Data
Q1 2018 1 December 2017 to 28 February 2018; Q1 2017 1 December 2016 to 28 February 2017
22
Financial Bridges 2018
These bridges summarise the key reconciling items between the As Acquired, Pro Forma and Statutory financials. In Q1 2018 the Group had £2.4m of non-cash/non recurring items which were excluded from EBITDA on a Pro Forma basis in accordance with definitions contained in the Indenture. Compared to the Statutory accounts (which exclude PF adjustments such as Real D) the differences of £0.1m in Q1 2018 represent non recurring items which do not meet the accounting definition on exceptional due to low materiality.
(1) EBITDA excluding Rentals under
Quarter YTD As Acquired to Pro Forma 3 Months ended 28 February 2018 Year to date ended to 28 February 2018 As Acquired RealD PF Pro Forma As Acquired RealD PF Pro Forma Turnover 246.3
246.3
Cost of Sales (92.3)
(92.3)
154.0
154.0
Admin expenses (64.2) 0.4 (63.8) (64.2) 0.4 (63.8) Rentals under operating leases (34.8)
(34.8)
EBITDA 55.1 0.4 55.5 55.1 0.4 55.5 Non-recurring / exceptional Items (2.5) (0.4) (2.9) (2.5) (0.4) (2.9) Depreciation (14.1)
(14.1)
Amortisation (0.8)
(0.8)
Group operating profit / (loss) 37.7
37.7
EBITDAR (1) 89.9 0.4 90.3 89.9 0.4 90.3 Quarter YTD As Acquired to Statutory 3 Months ended 28 February 2018 Year to date ended to 28 February 2018 As Acquired Non Rec Statutory As Acquired Non Rec Statutory Turnover 246.3
246.3
Cost of Sales (92.3) (92.3) (92.3) (92.3) 154.0
154.0
Admin expenses (64.3) (0.1) (64.3) (64.2) (0.1) (64.3) Rentals under operating leases (34.8) (34.8) (34.8) (34.8) EBITDA 55.1 (0.1) 55.0 55.1 (0.1) 55.0 Non-recurring / exceptional Items (2.5) 0.1 (2.4) (2.5) 0.1 (2.4) Depreciation (14.1) (14.1) (14.1) (14.1) Amortisation (0.8) (0.8) (0.8) (0.8) Group operating profit / (loss) 37.7
37.7
EBITDAR (1) 89.9 (0.1) 89.7 89.9 (0.1) 89.7
23
Financial Bridges 2017
These bridges summarise the key reconciling items between the As Acquired, Pro Forma and Statutory financials. In Q1 2017 the Group had £1.8m of non-cash/non recurring items which were excluded from EBITDA on a Pro Forma basis in accordance with definitions contained in the Indenture.
(1) EBITDA excluding Rentals under
Quarter YTD As Acquired to Pro Forma 3 Months ended 28 February 2017 3 Months ended 28 February 2017 As Acquired RealD PF Pro Forma As Acquired RealD PF Pro Forma (2) Turnover 236.6
236.6
Cost of Sales (88.6)
(88.6)
148.0
148.0
Admin expenses (58.9) 0.2 (58.7) (58.9) 0.2 (58.7) Rentals under operating leases (33.0)
(33.0)
EBITDA 56.1 0.2 56.3 56.1 0.2 56.3 Non-recurring / exceptional Items (1.8) (0.2) (2.1) (1.8) (0.2) (2.1) Depreciation (13.4)
(13.4)
Amortisation (0.6)
(0.6)
Group operating profit / (loss) 40.3
40.3
EBITDAR (1) 89.1 0.2 89.4 89.1 0.2 89.4 Quarter YTD As Acquired to Statutory 3 Months ended 28 February 2017 3 Months ended 28 February 2017 As Acquired Statutory As Acquired Statutory Turnover 236.6 236.6 236.6 236.6 Cost of Sales (88.6) (88.6) (88.6) (88.6) 148.0 148.0 148.0 148.0 Admin expenses (59.0) (58.9) (58.9) (58.9) Rentals under operating leases (33.0) (33.0) (33.0) (33.0) EBITDA 56.1 56.1 56.1 56.1 Non-recurring / exceptional Items (1.8) (1.8) (1.8) (1.8) Depreciation (13.4) (13.4) (13.4) (13.4) Amortisation (0.6) (0.6) (0.6) (0.6) Group operating profit / (loss) 40.3 40.3 40.3 40.3 EBITDAR (1) 89.1 89.1 89.1 89.1