1 Alluvial and aeolian processes transport and deposit parent - - PDF document

1
SMART_READER_LITE
LIVE PREVIEW

1 Alluvial and aeolian processes transport and deposit parent - - PDF document

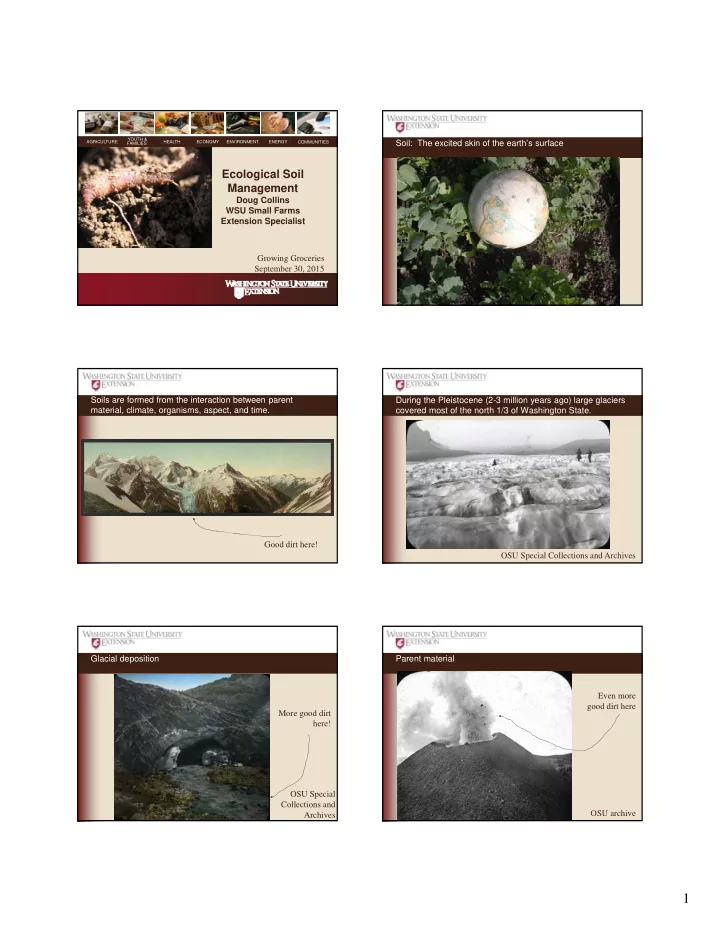
YOUTH & Soil: The excited skin of the earths surface AGRICULTURE HEALTH ECONOMY ENVIRONMENT ENERGY COMMUNITIES FAMILIES Ecological Soil Management Doug Collins WSU Small Farms Extension Specialist Growing Groceries September


slide-1
SLIDE 1

1

YOUTH & FAMILIES AGRICULTURE HEALTH ECONOMY ENVIRONMENT ENERGY COMMUNITIES

Ecological Soil Management

Doug Collins WSU Small Farms Extension Specialist Growing Groceries September 30, 2015 Soil: The excited skin of the earth’s surface Soils are formed from the interaction between parent material, climate, organisms, aspect, and time. Good dirt here! During the Pleistocene (2-3 million years ago) large glaciers covered most of the north 1/3 of Washington State. OSU Special Collections and Archives Glacial deposition OSU Special Collections and Archives More good dirt here! Parent material OSU archive Even more good dirt here

slide-2
SLIDE 2

2

Alluvial and aeolian processes transport and deposit parent material National Archives and Records Administration Climate influences the speed of weathering for minerals Vaquero Francis Aspect influences water and light dynamics Above and below-ground organisms also influence soil development Farming practices also influence soil processes

  • rganism

Cover cropping is a management practice to influence soil processes

slide-3
SLIDE 3

3

Time is also an important factor in soil processes.

Photo by Wolfgang Staudt

Soils are stratified vertically by horizons. Soils in the same soil series have similar characteristics There are more than 20,000 soil series

  • Soils formed on glacial terraces

Lynden, Kickerville, Laxton, Tromp

  • Soils formed on flood plains:
  • Mt. Vernon, Puyallup

Ecological Soil Management Outline

  • I. Natural history, soil formation, general soil

information

  • II. Soil fertility, productivity, health, and tilth
  • III. Soil nutrients, nutrient pools and pH
  • IV. Organic matter, nitrogen mineralization and cover

crops

  • V. Compost and other amendments
  • VI. Double Digging Experiment

November 11: Interpreting soil test

Photo by Dennis Wilkinson

Fertility is one component of soil health and productivity. A fertile soil may not be a productive soil

Productivity

Limits to productivity:

  • Light
  • Water
  • Nutrient availability
  • Plant pathogens/pests
  • Herbicide use
  • Overworked

Photo by Kate Halstead

“Quality” or “healthy” soil has the continued capacity to provide functions and does not degrade the surrounding environment

Gene Williams, Snohomish County Surface Water Management

slide-4
SLIDE 4

4

Soil with good tilth contains:

  • Stable soil aggregates
  • Even moisture levels
  • Pathways for air and water
  • Good drainage

Extremes such as excessive tillage can degrade soil tilth. 0.05mm

. . . . . . . . . . . . . . . . . .

sand silt clay

Soil texture Particle size distribution affects:

  • Drainage
  • Aeration
  • Water retention
  • Nutrient exchange

Soil texture is inherent and cannot be changed

websoilsurvey.nrcs.usda.gov

Soil texture can be estimated by hand with the ribbon test. http://soils.puyallup.wsu.edu/video_soiltexture/

Organic matter

Adding organic matter:

  • Helps build soil structure
  • Improves water retention
  • Adds slow-release source
  • f nutrients

Photo by Craig Cogger

Mix organic matter into the soil by hand or with a machine

Photo by Amy Zarrett

slide-5
SLIDE 5

5

Double digging to add organic matter and improve tilth Organic matter can be left on the soil surface

Percentage of elements present in a healthy plant Macronutrients Micronutrients

Carbon (C) 45.00% Chlorine (Cl) 0.01 % Oxygen (O) 45.00% Iron (Fe) 0.01% Hydrogen (H) 6.00% Manganese (Mn) 0.005% Nitrogen (N) 1.50% Boron (B) 0.002% Potassium (K) 1.00% Zinc (Zn) 0.002% Calcium (Ca) 0.50% Copper (Cu) 0.0006% Phosphorus (P) 0.20% Molybdenum (Mo) 0.00001% Magnesium (Mg) 0.20% Nickel (Ni) 0.000001% Sulphur (S) 0.20% Percentages by plant dry weight

Plant Nutrients Nitrate NO3

  • Ammonium

NH4

+

Phosphorus H2PO4

  • Potassium

K+

Ions are forms of nutrients available for plant uptake

Anions (negative) Cations (positive) Nutrient pools: Parent material (e.g. rocks/minerals), is a source

  • f very slowly available nutrients.

Minerals e.g.: Hornblende (Ca2Al2Mg2Fe3Si6O22(OH)2) Potassium Feldspar (KAlSi3O8)

K+ Fe2+ Mn+

Elements unavailable Weathering physical and chemical Elements available “nutrients”

Ca2+

Parent material = rich, frugal uncle – v. slowly available

slide-6
SLIDE 6

6

Mineralizeable = Stocks and Bonds – slowly available Parent material = rich, frugal uncle – v. slowly available Organic matter unavailable mineralization available NH2 PO3 SH PO4

  • SO4

2-

NH4

+

NO3

  • NH2

C-C-C-C- Nutrient pools: Organic matter is a source of slowly available nutrients. Adsorbed nutrients= Checking acct– quickly available Mineralizeable = Stocks and Bonds – slowly available Parent material = rich, frugal uncle – v. slowly available

K+ NH4

+ Ca2+ SO4 2-

soluble, available

  • -
  • Ca2+

K+ clay OM

  • Mg2+

K+

Nutrient pools: Surfaces of humus and clay store quickly available nutrients.

Adsorbed nutrients= Checking acct– quickly available Soil solution = Cash – available now Mineralizeable = Stocks and Bonds – slowly available Parent material = rich, frugal uncle – v. slowly available K+ NH4

+ Ca2+ SO4 2-

soluble, available

Nutrient pools: Nutrients in the soil solution are immediately available. Typical CEC values for different soil textures

Soil Type CEC meq/100g Sands (light colored) 3 to 5 Sands (dark colored) 10 to 20 Loams 10 to 15 Silt Loams 15 to 25 Clay and clay loams 20 to 50 Organic soils 50 to 100

Soil pH and nutrient availability

pH

Measure of how acid or alkaline a substance is

(related to H conc.)

6.0 to 7.5 ideal for most crops Blueberries 4.5 to 5.5 pH VALUE TABLE

4.0 5.0 6.0 6.6 7.0 7.6 8.5 9.0 9.5 10.0

ACID NEUTRAL ALKALINE

slide-7
SLIDE 7

7

Nitrogen cycles from cover crops and amendments through the microbial biomass Isopods Collembola earthworms nematodes Microbial Biomass Bacteria Fungi available N Soil OM protozoa atmospheric N2 amendment legume C, N N excreted Soil organic matter is split between active organic matter and humus. Air Water Silt Clay Sand Organic Matter Living Organisms Soil Humus Active Organic Matter Cover crops improve soil quality, protect soil, smother weeds, take up excess nutrients from the soil, and legumes add nitrogen Clover & rye mix in garden bed, 7 days after planting Vetch & rye mix in farm field, 45 days after planting PAN from organic fertilizers ranges from $5 to $9 per pound. Legume cover crops can provide PAN at $1 to $3 per pound. Cover Crops for Home Gardens East of the Cascades: Winter

Cover Crop Comments Planting Rate Planting Date lbs/a c/100ft2 Aug Sept Oct Nov Cereal Rye Hardy 180 1 Winter Wheat 180 1 Winter Oats 180 1 ½ Triticale 180 1 Annual Ryegrass Good in wet 90 ½ Spring Barley Winterkills 180 1 Spring Oats Winterkills 180 1 ½ Hairy Vetch Reliable 90 ½ Crimson Clover 20 ¼ Austrian Winter Pea Not wet soil 90 1 Fava Beans-small May winterkill 100 1 Mustard/Canola Winterkills 20

1/8

Cover Crops for Home Gardens West of the Cascades: Winter

Cover Crop Comments Planting Rate Planting Date lbs/a c/100ft2 Aug Sept Oct Nov Cereal Rye Hardy 180 1 Winter Wheat 180 1 Winter Oats 180 1 ½ Annual Ryegrass Good in wet 90 ½ Spring Barley Winterkills 180 1 Spring Oats Winterkills 180 1 ½ Hairy Vetch Reliable 90 ½ Crimson Clover Soil builder 20 ¼ Red Clover Soil builder Austrian Winter Pea Not wet soil 90 1 Fava Beans-small May winterkill 100 1 Phacelia Pollinators 20

1/8

slide-8
SLIDE 8

8

Cover Crops for Home Gardens East of the Cascades: Summer

Cover Crop Comments Planting Rate Planting Date lbs/a c/100ft2 Apr May June July Aug Buckwheat Short season 50 1 Brassicas Short season 15

1/8

Crimson Clover Legume 30 ¼ Red Clover Legume 15 ¼ Sweet Clover Legume 20 ¼ Annual Alfalfa Legume 20 ¼ Sorghum/Sudan Hot weather 50

1/8

Millets Hot weather 20

1/8

Cover Crops for Home Gardens West of the Cascades: Summer

Cover Crop Comments Planting Rate Planting Date lbs/a c/100ft2 Apr May June July Aug Buckwheat Short season 50 1 Brassicas Short season 15

1/8

Crimson Clover Legume 30 ¼ Sorghum/Sudan Hot weather 50

1/8

Fava Bean Cool weather 100 1

slide-9
SLIDE 9

9

Compost management

Compost applied at 10 ton / acre Compost applied at 2 ton / acre Carbon to Nitrogen (C:N) ratio between 10:1 and 20:1 Goals for application influences type and amount

C:N ratio of different amendments

Hot : less than 10:1 Cool : 15:1 to 25:1 Woody : over 30:1

Photo by: Scot Nelson

C:N less than 10:1 HOT

  • Easy to over-apply
  • Leads to excess nutrient levels
  • Potential to harm crop
  • Degrade water quality

Fish and feather meals Poultry/ Fresh rabbit manure Seed meals

Photos by Peter Moon, O2 Composting

C:N from 15:1 to 25:1 COOL

  • Slow-release nitrogen
  • Use as soil amendment
  • Releases additional nutrients in

subsequent seasons

Composted:

  • yard debris
  • most manures
  • biosolids

Fresh materials:

  • yard debris
  • coffee grounds
  • dairy manure solids

C:N over 30:1

  • Straw
  • Sawdust
  • Paper waste
  • Horse bedding
  • Leaves
  • Nitrogen immobilization
  • Use as mulch
  • Carbon resource in compost

Photo by Andy Bary, WSU

Practice ‘safe’ manure

  • Incorporate compost well before planting
  • Apply to rotation crops not harvested as food
  • Use legumes instead
  • Use processed, not raw, manures
  • “Waiting periods” between application and

harvest (90 or 120 days for National Organic Program) are general recommendations, not infallible truth. Also raw versus cooked foods.

  • NEVER apply manure or manure-based teas to

food crops nearing maturity or harvest

Photo by: Len Radin

slide-10
SLIDE 10

10

Does double digging to establish a garden bed increase yield? Prior to starting the experiment, compaction increased to 2.5 inches and was essentially impenetrable at 6 to 7 inches

An experiment with 4 replications was conducted to compare soil garden bed preparation with double digging and rototilling.

Initial Soil Parameters

Depth pH lime req t/a OM % Pb ppm As ppm P ppm Thatch 5.2 15.4 148.3 13.0 168.0 0‐6 in 5.8 2.6 7.5 63.7 13.2 202.0 6‐12 in 5.5 1.4 2.2 103.3

After treatments, double dug soils had much less compaction between 8 and 40 inches

slide-11
SLIDE 11

11

Double digging did not improve lettuce yield. Lettuce plants did look more uniform and healthy with rototilling Double Dug Rototilled Double digging increased carrot yield by 23% Double Dug Rototilled Double Dug Rototilled Double digging did not improve lettuce yield. Lettuce plants did look more uniform and healthy with rototilling 1600 tomatoes, 330 lbs, average of 10.3 lbs/plant (1 plant/4 ft2) Considerations for ecological soil management Five soil forming factors - parent material, climate, aspect, time, and organisms

  • interact to form specific soil types.

Soil nutrients exist in different “pools” with varying levels of availability. Soil tests approximate nutrient availability. Utilize cover crops and proper amounts of

  • rganic amendments to feed crops,

build humus, and develop a bank of slow-release nutrients. Thank you!

Doug Collins WSU Small Farms Program dpcollins@wsu.edu 253-445-4658

All photos were taken by Doug Collins, unless otherwise noted. Resources

Collins, D.P. 2012. Soil Testing: A Guide for Farms with Diverse Vegetable Crops. Washington State University Extension Publication EM050E. http://cru.cahe.wsu.edu/CEPublications/EM050E/EM050E.pdf. Collins, D.P., C. Miles, C.G. Cogger, and R. Koenig. 2013. Soil Fertility in Organic Systems: A Guide for Gardeners and Small Acreage Farmers. Pacific Northwest Extension Publication PNW 646. Horneck, D.A., D.M. Sullivan, J.S. Owen, and J.M. Hart. 2011. Soil Test Interpretation Guide. Oregon State University Extension EC 1478. http://ir.library.oregonstate.edu/xmlui/bitstream/handle/1957/22023/ec1478.pdf. Solomon, S. 2007. Growing Vegetables West of the Cascades, 6th Edition. Sasquatch Books, Seattle,

  • WA. 368 pgs.

Cogger, C., C. Benedict, N. Andrews, S. Fransen, and A. McGuire. Cover Crops for Home Gardens – East of the Cascades. Washington State University Extension Publication FS117E. http://cru.cahe.wsu.edu/CEPublications/FS117E/FS117E.pdf Cogger, C., C. Benedict, N. Andrews, and A. McGuire Cover Crops for Home Gardens – West of the

  • Cascades. Washington State University Extension Publication FS111E.

http://cru.cahe.wsu.edu/CEPublications/FS111E/FS111E.pdf

slide-12
SLIDE 12

12

Extractants are used to indicate plant nutrient availability, not total nutrient content.

Plant Nutrient Common Extractants NO3

  • KCl, CaCl2

NH4+ KCL H2PO4

  • /HPO4
  • 2

NH4F/HCL (Bray-P) NH4F/CH3COOH/H NO3(Melich-P) NaHCO3 (Olsen-P) K+ NHaOAc SO4

  • 2

Ca(H2PO4)2,CaCl2 Zn+2,Fe+3,Mn+2,Cu+2 DTPA,EDTA H3BO3 Hot Water Cl- Water

Soil nutrients cycle through different ‘pools’ in the soil Soil tests indicate how much of a nutrient is likely to be available to plants Different soils will have different initial soil quality. Monitoring through time is the best way to evaluate management Soil A Soil B Time Soil Quality

slide-13
SLIDE 13

13

In the maritime northwest, nitrogen sampling is done in fall for “report card” nitrate test

NO3

  • -N in surface foot (ppm)

Low <10 Medium 10-20 High 20-30 Excessive >30

Soil test vs. probability of crop response.

Soil phosphorous transported off-farm can degrade surface water quality.

Photo by: Gene Williams, Snohomish County Surface Water Management

Base Cations

slide-14
SLIDE 14

14

Reserve acidity is the store of hydrogen ions on exchange sites. How much lime is required to change the soil pH?

  • -
  • -
  • Ca2+ K+

Mg2+

High reserve acidity

H+

clay OM

H+ H+ H+ H+ H+ H+ H+ H+

  • Mg2+

K+

Low reserve acidity

K+

  • -
  • -
  • Ca2+ K+

H+ Ca2+ Ca2+

  • H+

H+ H+

Planning for Soil Testing Group soil tests by management zones: contiguous areas that are planted, fertilized, and otherwise managed together.