
1
1
SAGE Visualization Tool for Gene SAGE Visualization Tool for Gene Expression Analysis Expression Analysis
Presented by: Timothy Chan and Zsuzsanna Hollander
2
Gene Expression and Motivation Gene Expression and Motivation
1. All living things are made up of cells. 2. All cells contain genes which have the information to create all sorts of proteins in our bodies including our nails, hair, enzymes etc. 3. Different cell types contain the same DNA, but are different because different proteins are synthesized and produced. 4. A cell can change the expression level of its genes in response to various signals (ie. Stress, heat, damage, etc). 5. Gene expression levels are different in diseased cells and normal cells.
3
SAGE SAGE
1.
Advent of large-scaled gene expression technologies have allowed simultaneous analysis
- f 10’s of thousands of genes.
2.
SAGE (Serial Analysis of Gene Expression) is a sequenced based method to quantify gene expression levels in cells.
3.
Method based on taking a small sequence (called a TAG) of an mRNA to represent a gene.
4
- CCCATCGTCC
- CACTACTCAC
- TTCACTGTGA
- CCTCCAGCTA
- ACTAACACCC
- ACGCAGGGAG
- CTAAGACTTC
- AGCCCTACAA
- TGCTCCTACC
- GCCCAGGTCA
- ACTTTTTCAA
- CAAACCATCC
- CACCTAATTG
- GCCGGGTGGG
- CCCCCTGGAT
- CCTGTAATCC
- GACATCAAGT
- ATTGGAGTGC
- TTCATACACC
- ATCGTGGCGG
- GCAGGGCCTC
- ACATTGGGTG
- GACCCAAGAT
- CCGCTGCACT
- GTGAAACCCC
- GTGAAACCCT
- GGAAAACAGA
- CCACTGCACT
- CTGGCCCTCG
- TCACCGGTCA
- TGATTTCACT
- GCTTTATTTG
- GTGCACTGAG
- ACCCTTGGCC
- CTAGCCTCAC
- CCTCAGGATA
- ATTTGAGAAG
- GCGAAACCCT
- CTCATAAGGA
- GTGACCACGG
- AAAACATTCT
- ATCATGGGGA
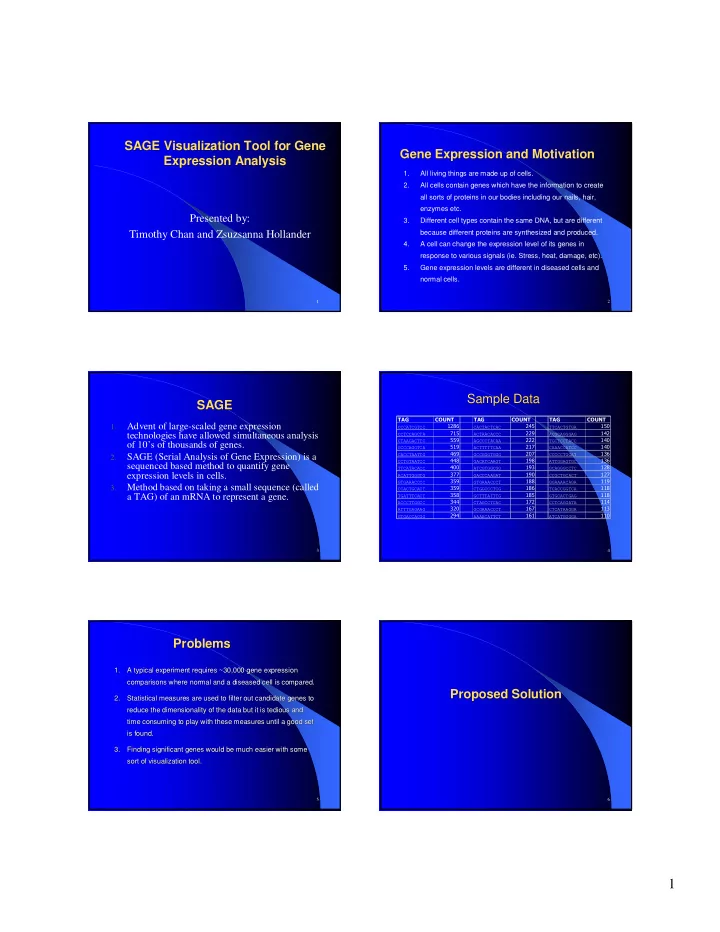
- Sample Data
Sample Data
5
Problems Problems
1. 1. A typical experiment requires ~30,000 gene expression A typical experiment requires ~30,000 gene expression comparisons where normal and a diseased cell is compared. comparisons where normal and a diseased cell is compared. 2. 2. Statistical measures are used to filter out candidate genes to Statistical measures are used to filter out candidate genes to reduce the dimensionality of the data but it is tedious and reduce the dimensionality of the data but it is tedious and time consuming to play with these measures until a good set time consuming to play with these measures until a good set is found. is found. 3. 3. Finding significant genes would be much easier with some Finding significant genes would be much easier with some sort of visualization tool. sort of visualization tool.
6