1. Introduction @ MaxChamb - chamberm.github.io There is an urgent - - PowerPoint PPT Presentation

1 introduction
SMART_READER_LITE
LIVE PREVIEW

1. Introduction @ MaxChamb - chamberm.github.io There is an urgent - - PowerPoint PPT Presentation

Tractometry-based Anomaly Detection for Single-subject White Matter Analysis Chamberland et al. MIDL 2020 1. Introduction @ MaxChamb - chamberm.github.io There is an urgent need for a paradigm shift from group-wise comparisons 1 (N vs M) to


slide-1
SLIDE 1
  • 1. Introduction

Chamberland et al. MIDL 2020 Tractometry-based Anomaly Detection for Single-subject White Matter Analysis

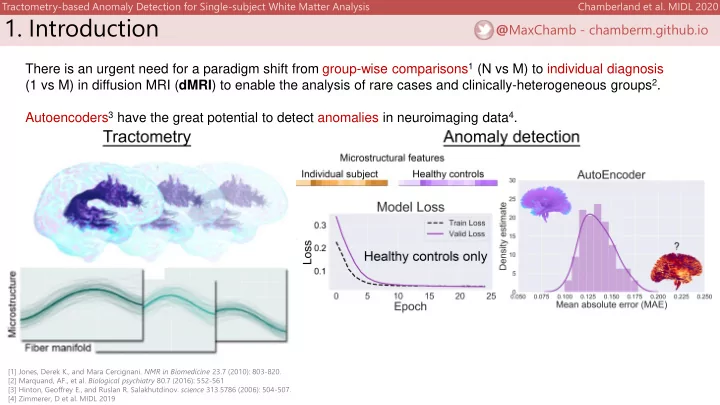
There is an urgent need for a paradigm shift from group-wise comparisons1 (N vs M) to individual diagnosis (1 vs M) in diffusion MRI (dMRI) to enable the analysis of rare cases and clinically-heterogeneous groups2. Autoencoders3 have the great potential to detect anomalies in neuroimaging data4.

[1] Jones, Derek K., and Mara Cercignani. NMR in Biomedicine 23.7 (2010): 803-820. [2] Marquand, AF., et al. Biological psychiatry 80.7 (2016): 552-561 [3] Hinton, Geoffrey E., and Ruslan R. Salakhutdinov. science 313.5786 (2006): 504-507. [4] Zimmerer, D et al. MIDL 2019

@MaxChamb - chamberm.github.io

slide-2
SLIDE 2

2.1 Methods

Tractometry

  • Automated tract segmentation using TractSeg6
  • Tractometry7-9 using FA, MD, RISH0 and RISH210
  • Tract profiles → feature vector
  • n = 26 tracts × 20 locations = 520 features for each subject.

Dataset

90 typically developing children (TD, 8-18 years) 8 children with copy-number variants (CNV, 8-15 years) Preprocessed5 as in Chamberland et al. 2019

2×2×2 mm³ isotropic voxels and 30 diffusion directions at b = 500 s/mm², 30 … at b = 1200 s/mm², 60 … at b = 2400 s/mm², 60 … at b = 4000 s/mm², 60 … at b = 6000 s/mm² (Siemens 3T Connectom scanner @300 mT/m)

Chamberland et al. MIDL 2020 Tractometry-based Anomaly Detection for Single-subject White Matter Analysis

[5] Chamberland, M, et al. NeuroImage 200 (2019): 89-100. [6] Wasserthal, J, et al. NeuroImage 183 (2018): 239-253. [7] Bells, S. et al. In Proc ISMRM 2011. [8] Cousineau, M. et al. NeuroImage: Clinical 16 (2017): 222-233. [9] Yeatman, JD., et al. PloS one 7.11 (2012). [10] Mirzaalian, H. et al. NeuroImage 135 (2016): 311-323.

Minimize ො 𝑦 x @MaxChamb - chamberm.github.io

slide-3
SLIDE 3

2.2 Methods

Chamberland et al. MIDL 2020 Tractometry-based Anomaly Detection for Single-subject White Matter Analysis

Evaluation

  • Validation set (n = 16) → CNV (n = 8) + a random subset of TD (n = 8).
  • The rest of the TD (n = 82) data was used to establish a normative distribution.
  • Anomaly score → mean absolute error (MAE) over all features.
  • CV shuffle repeat 100 times → derive a mean anomaly score per subject.

Z vs M vs MAE

Univariate Z-score PCA + Mahalanobis Distance Autoencoder + Mean Absolute Error

[9] Yeatman, JD., et al. PloS one 7.11 (2012). [11] Taylor, PN, et al. Neurology (2020).

Using the subject labels, we report the mean ROC area under the curve (AUC) across the iterations and compared the results with traditional Z-score9 and PCA11 approaches.

@MaxChamb - chamberm.github.io

slide-4
SLIDE 4
  • 3. Results

Chamberland et al. MIDL 2020 Tractometry-based Anomaly Detection for Single-subject White Matter Analysis

For all four microstructural metrics, the autoencoder approach was better at identifying CNV subjects as

  • utliers,

providing substantially higher sensitivity- specificity trade-offs. Anomalies mostly occurred along the ILF and OR bundles (bilateral). @MaxChamb - chamberm.github.io

slide-5
SLIDE 5
  • 4. Feature inspection

Chamberland et al. MIDL 2020 Tractometry-based Anomaly Detection for Single-subject White Matter Analysis

A key advantage of using deep autoencoders for anomaly detection

  • ver

traditional PCA-derived approach is their unique ability to interpret anomaly scores based on feature inspection.

Peer-reviewed short paper (@MIDL2020): arxiv.org/abs/2005.11082

@MaxChamb - chamberm.github.io