1 introduction
play

1 Introduction The KM3NeT Collaboration is constructing an - PDF document

1 Introduction The KM3NeT Collaboration is constructing an underwater neutrino research infrastructure in the deep Mediterranean Sea. The science objective of KM3NeT is twofold: 1) The study of neutrino parameters, in particular the


  1. 1 Introduction The KM3NeT Collaboration is constructing an underwater neutrino research infrastructure in the deep Mediterranean Sea. The science objective of KM3NeT is twofold: 1) The study of neutrino parameters, in particular the determination of the neutrino mass hierarchy with the KM3NeT/ORCA detector off-shore Toulon, France and 2) the discovery and subsequent observa- tion of high-energy neutrino sources in the Universe using the KM3NeT/ARCA detector off-shore Capo Passero, Italy ? . The construction of the KM3NeT ARCA (resp. ORCA) detectors has started in December 2015 (September 2017) with the successfull deployment of the first detection units. In this paper, the profound understanding of our detector will be underlined by comparing results obtained from the first data with detailed Monte Carlo simulations. To this extend, data taken during a stable period from ... to ... will be used. 2 The KM3NeT Detector 
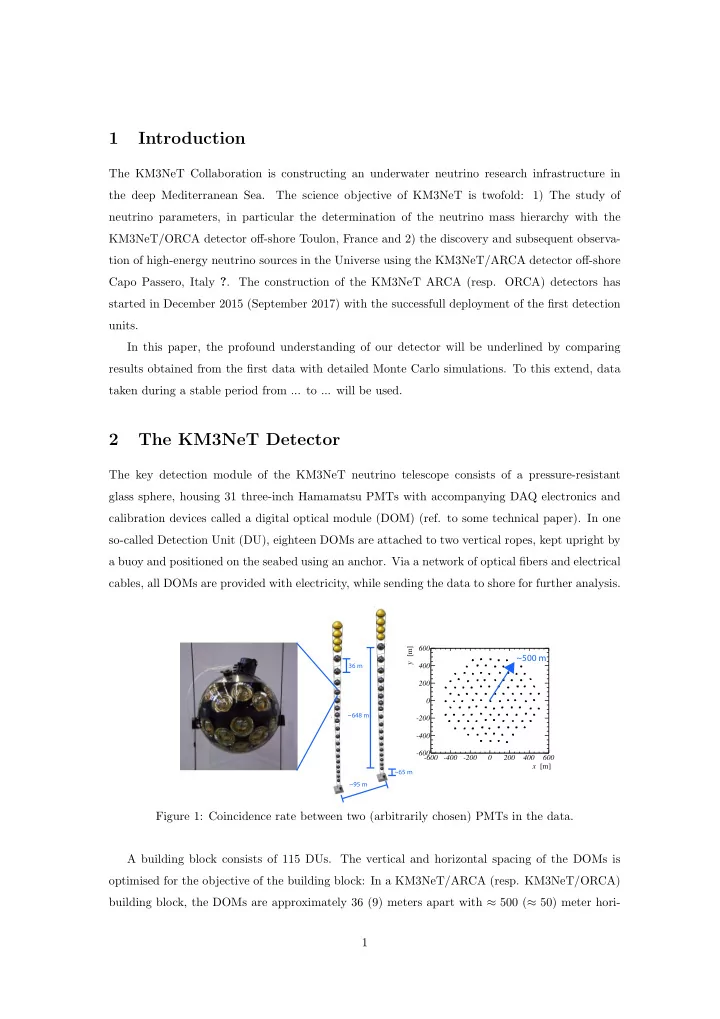
The key detection module of the KM3NeT neutrino telescope consists of a pressure-resistant glass sphere, housing 31 three-inch Hamamatsu PMTs with accompanying DAQ electronics and calibration devices called a digital optical module (DOM) (ref. to some technical paper). In one so-called Detection Unit (DU), eighteen DOMs are attached to two vertical ropes, kept upright by a buoy and positioned on the seabed using an anchor. Via a network of optical fibers and electrical cables, all DOMs are provided with electricity, while sending the data to shore for further analysis. 600 [m] ~500 m y 400 36 m 200 0 ~648 m -200 -400 -600 -600 -400 -200 0 200 400 600 x [m] ~65 m ~95 m Figure 1: Coincidence rate between two (arbitrarily chosen) PMTs in the data. A building block consists of 115 DUs. The vertical and horizontal spacing of the DOMs is optimised for the objective of the building block: In a KM3NeT/ARCA (resp. KM3NeT/ORCA) building block, the DOMs are approximately 36 (9) meters apart with ≈ 500 ( ≈ 50) meter hori- 1

  2. zontal spacing between the DUs. The waveforms of all 31 PMTs in a DOM are digitised with a time-over-threshold technique as described in (ref. to some technical paper/LoI). The hits of all DOMs are send to the shore-station, where the time-calibration is applied and multiple trigger-algorithms write out all physics events. A dedicated datastream focusses on calibration and monitoring of the data. In this datastream, all local coincidences of hits within 25 nanoseconds on each DOM are written. For the results obtained in this paper, this datastream is used. 3 Inter-PMT Calibration The light produced in the radioactive decays of 40 K isotopes is used to calibrate the relative PMT efficiencies and time offsets of the PMTs within a DOM. The method used is described in detail in ? . In figure 2, the distribution of the fitted relative PMT efficiencies is shown. As can be seen, the mean PMT efficiency is 17% larger than nominal, indicating that the PMTs are seeing more light than expected from detailed GEANT4 simulations. A second population of PMTs towards lower efficiencies can be observed. These PMTs are all located close to the DOM support structure. All PMTs close to any support structure are excluded in the green distribution, as can be seen, the resulting PMT efficiencies are Gaussian distributed with a mean (sigma) of 1.20 (0.07). KM3NeT ARCA DU1+2 Preliminary PMTs All PMTs 150 µ σ = 1.17, = 0.08 Unobstructed PMTs µ σ = 1.20, = 0.07 100 50 0 0.8 0.9 1 1.1 1.2 1.3 1.4 1.5 40 K efficiency [a.u.] Figure 2: Distribution of fitted PMT efficiencies, obtained from 40 K measurements. The blue distribution includes all PMTs, the green distribution only PMTs unobstructed by the external DOM support structure. stability? 2

  3. 4 Monte-Carlo Simulations Stability? PMT gain and gainspread, singles rates? Apart from the detailed GEANT4 simulations of 40 K decays, a set of Monte-Carlo simualted atmospheric muon events has been obtained. The flux of atmospheric muons is simulated using the fast mupage parametrisation (ref), followed by the simulation and propagation of the produced Cherenkov photons with the km3 package (ref). The detector response has been simulated using the internal KM3NeT application JTriggerEf- ficiency . The pmt gain and gainspread, relative efficiencies obtained from the 40 K fit procedure and livetime are taken into account on a run-by-run basis. 5 Coincidences and Muon Depth Dependence Include stability? The distribution of the number of PMTs in a DOM coincidentally registering a hit is shown in figure 3. A coincidence of N PMTs is defined as a sequence of hits on N unique PMTs within a time window of 25 nanoseconds from the first hit. KM3NeT ARCA DU1+2 Preliminary 4 10 Random coincidences [Hz] 40 3 K simulation 10 L1F1: Atm. muon simulation 2 Rate 10 L2F18: Atm. muon simulation 10 L1F1: Total simulation L1F1: Data 1 L2F18: Total simulation − 1 10 L2F18: Data − 2 10 − 3 10 − 4 10 − 5 10 − 6 10 − 7 10 5 10 15 20 25 30 PMTs in coincidence Figure 3: Distribution of number of unique PMTs hit in coincidence. The distributions of DOMs L1F1 ( ≈ 3 . 4 kilometers below sealevel) and L2F18 ( ≈ 2 . 7 kilometers below sealevel) are given in blue and red respectively. Coincidences up to 6 PMTs are dominated by random coincidences of uncorrelated hits and correlated hits from 40 K decays. All coincidences at least 8 PMTs are well-described by the flux of atmospheric muons. As can be seen, the simulations of both processes are in excellent agreement 3

  4. with the observed data over 8 orders of magnitude. While the rate of 40 K decays is constant along the line, the number of muons decreases with depth due to the energy loss of muons in the seawater. In figure 3, this is apparent from the comparison between the distributions of DOM L1F1 at a depth of ≈ 3 . 4 kilometers and L2F18 at a depth of ≈ 2 . 7 meters. The integrated ≥ 8-fold coincidence rate of all active DOMs is plotted in figure 4. KM3NeT ARCA DU1+2 Preliminary 60 [mHz] DU 1: Data DU 1: Atm. muon simulation 50 DU 2: Data Rate DU 2: Atm. muon simulation 40 30 20 10 0 2.8 2.9 3 3.1 3.2 3.3 3.4 Depth [km] Figure 4: Integrated ≥ 8-fold coincidence rate of all DOMs as function of depth below the sealevel. The exponential trend of the expected number of muons is clearly visible in the data. Variations due to the differences in the PMT efficiencies of the DOMs are well described by the run-by-run atmospheric muon simulations. 6 Conclusions First detection lines succesfully deployed and work as expected Profound understanding of our detector in MC First measurement of the muon flux in an deep-sea neutrino telescope? References S. Adrin-Martnez et al. ( The KM3NeT Collaboration ). Letter of Intent for KM3NeT 2.0. arXiv , (1601.07459), 2016. K.W.Melis on behalf of the KM3NeT Collaboration . In-Situ Calibration of KM3NeT. In PoS(ICRC2017)1059 , 2017. 4

Download Presentation
Download Policy: The content available on the website is offered to you 'AS IS' for your personal information and use only. It cannot be commercialized, licensed, or distributed on other websites without prior consent from the author. To download a presentation, simply click this link. If you encounter any difficulties during the download process, it's possible that the publisher has removed the file from their server.

Recommend


More recommend