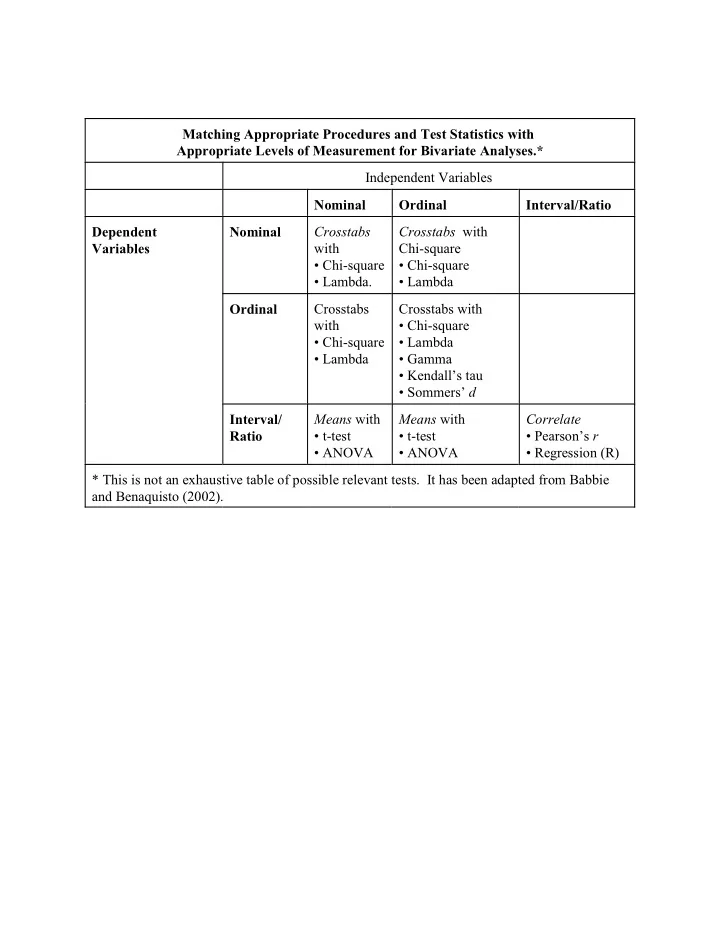
SLIDE 1 Matching Appropriate Procedures and Test Statistics with Appropriate Levels of Measurement for Bivariate Analyses.* Independent Variables Nominal Ordinal Interval/Ratio Dependent Variables Nominal Crosstabs with
Crosstabs with Chi-square
Ordinal Crosstabs with
Crosstabs with
- Chi-square
- Lambda
- Gamma
- Kendall’s tau
- Sommers’ d
Interval/ Ratio Means with
Means with
Correlate
- Pearson’s r
- Regression (R)
* This is not an exhaustive table of possible relevant tests. It has been adapted from Babbie and Benaquisto (2002).
SLIDE 2 Matching Appropriate Procedures and Test Statistics with Appropriate Levels of Measurement for Multivariate Analyses. Independent Variables Multiple Independent Variables (Including Both Interval/Ratio Variables, and Categorical Variables Coded as binary dummy variables: 0 or 1.) Dependent Variables Categorical where number of categories = 2
Categorical where number of categories > 2
- Multinomial Logistic Regression.
Interval/ Ratio
SLIDE 3
Example: Crosstabulation with Chi-square (Two Nominal Variables). Table 1. Employment Status By Gender (in Percentages for Women and Men). Gender Women Men Employment Status Full Time 43.2 65.9 Part Time 27.2 8.2 Unemployed 3.7 2.4 Other 2.5 4.7 Retired 23.5 18.8 Total 100 100 N 81 85 = 13.64, df = 4, p. < .01
SLIDE 4 Example: Intercorrelation Matrix (Three Interval/Ratio Level Variables). Table 2: Correlations Among Age, Education, and Personal Income. (N in parentheses.) Age Years of Education Personal Income Age
(177) .26** (159) Years of Education .23** (177)
(160) Personal Income .26** (159) .42** (160)
SLIDE 5
Example: Difference in Means with t-test (one nominal variable, three interval/ratio variables). Table 3. Means for Men and Women: Years of Experience, Years of Education, and Personal Income. Women Men Years of Experience Mean Standard Deviation N 8.90** 7.84 58 13.77** 11.16 68 Years of Education Mean Standard Deviation N 14.95* 2.12 94 15.74* 2.17 86 Personal Income Mean Standard Deviation N 24, 268** 19,098 82 46,968** 26,451 80 Observed significance values associated with t-tests of differences in means: * p. .05, ** p. .01.
SLIDE 6
Example of Frequencies and Percentages (Ordinal Variable). Table 4. Frequencies and Percentages for Political Efficacy Item #1: Sometimes Politics and Government Seem So Complicated that a Person Like Me Can’t Really Understand What’s Going On. Frequency Percentage Strongly Disagree 7 35.0 Disagree 2 10.0 No Opinion 2 10.0 Agree 4 20.0 Strongly Agree 5 25.0 Total 20 100.0
SLIDE 7
Example of Means, Standard Deviations, and N (Interval/Ratio Variables). Table 5. Means, Standard Deviations, and N. Variable Mean Standard Deviation N Years of Experience 11.53 10.04 126 Years of Education 15.36 2.17 183 Personal Income 35,478 25, 620 162
SLIDE 8 Example of Percentages (Several Ordinal Variables) Table 6. Percentages for Responses to Political Efficacy Items. Strongly Disagree Disagree No Opinion Agree Strongly Agree Item #1: Sometimes politics and government seem so complicated that a person like me can’t really understand what’s going on. 35 10 10 20 25 Item #2: The political parties are so big that I doubt I could influence them even if I were active in them. 30 20 5 15 30 Item #3: I believe that I can help to change the minds of public
25 20 10 20 25 Item #4: People like me don’t have any say about what the government does. 35 15 20 30 Item #5: Generally, those elected to Parliament soon lose touch with people. 35 15 5 20 25 Item #6: So many other people vote in elections that it doesn’t matter much whether I vote or not. 35 15 20 30 Item #7: I don’t think that the government cares much what people like me think. 35 15 10 40
SLIDE 9 Example of Multiple Regression Analysis with Standardized Regression Coefficients. Table 7. Standardized Regression Coefficients for Models Predicting Environmentally Friendly Behaviour: Entire Sample. Independent Variables Model 1 Model 2 Model 3 Model 4 Model 5 Gender (1= male)
- .11*
- .12*
- .12*
- Age
- .23***
- .22***
- .14*
- .24***
- .16**
Education (squared) .20*** .19*** .14* .20*** .15* Income (log)
Parent (1 = parent)
.07
- Gendpar (female parent = 1)
- .12*
.12* Post Materialist Values Index
Frequency of Communication (log)
Activism
R .09*** .09*** .19*** .11*** .20***
2
Adjusted R .07*** .08*** .17*** .09*** .12***
2
+ .10 * p. .05 ** p. .01 *** p. .005
- Variable not included in equation.
N=254 N=254 N=254 N=257 N=257