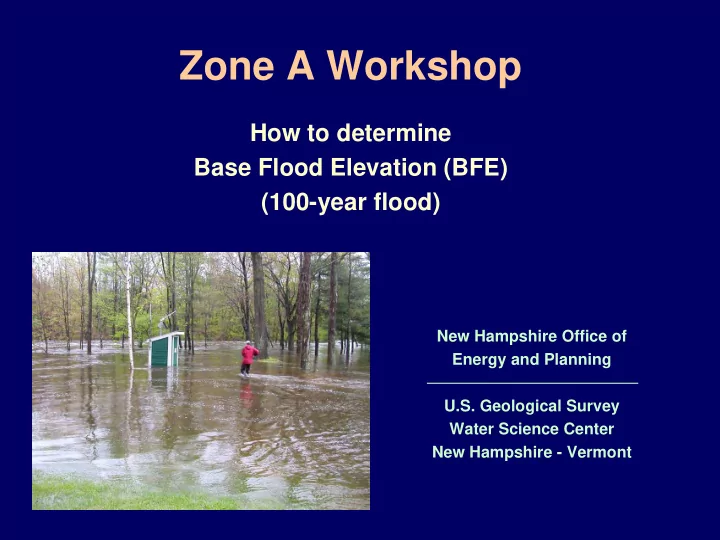
SLIDE 1 Zone A Workshop
How to determine Base Flood Elevation (BFE) (100-year flood)
New Hampshire Office of Energy and Planning U.S. Geological Survey Water Science Center New Hampshire - Vermont
SLIDE 2
Zone A Workshop Outline
I. Sources of Flood and Watershed Information II. How to Determine BFE: Simple Methods Detailed Methods III. Example of Determining Zone A BFE IV. Questions and Answers
SLIDE 3
- Draft flood studies (new or re-study)
FEMA
USACE, NRCS, Dam Bureau (NHDES)
- High flow design analysis (e.g. bridges)
FHA, NHDOT, County Highways, Public Works
Sources of Flood and Watershed Information Previous Flood Studies
SLIDE 4
Federal Agencies…...
FEMA Federal Emergency Management Agency USACE U.S. Army Corps of Engineers FHA Federal Highway Administration USGS U.S. Geological Survey NRCS Natural Resources Conservation Service NOAA National Oceanic and Atmospheric Administration
Sources of Flood and Watershed Information
SLIDE 5
State / Regional Agencies……
NHOEP N.H. Office of Energy and Planning NHDOT N.H. Department of Transportation NHDES N.H. Department of Environmental Services RPCs Regional Planning Commissions NERCC Northeast Regional Climate Center
Sources of Flood and Watershed Information
SLIDE 6
Sources of Flood and Watershed Information Local Agencies.
County Highway Department City / Town Engineer Department of Public Works
SLIDE 7
Zone A Workshop Outline
I. Sources of Flood and Watershed Information II. How to Determine BFE: Simple Methods Detailed Methods III. Example of Determining Zone A BFE IV. Questions and Answers
SLIDE 8
Extrapolation
upstream from existing study
River profile
SLIDE 9
SLIDE 10
SLIDE 11
Contour Interpolation
using topographic and Zone A maps
River Zone A Lake/Pond Zone A
SLIDE 12
SLIDE 13
SLIDE 14
SLIDE 16 Zone A boundary Zone A boundary Contour line Contour line
880 843 843 840
Contour Interpolation
SLIDE 17 Contour Interpolation
Left Bank: Zone A Boundary = 843 ft
Contour interval = 40ft
BFE = 837+40/2 = 857 ft Right Bank Zone A Boundary = 837 ft 843-837 = 6 ft OK (6<40/2)
880 880 840
SLIDE 18
Contour Interpolation
using topographic and Zone A maps
SLIDE 19
SLIDE 20
SLIDE 21
Contour Interpolation
Lowest perimeter point: Zone A Boundary = 1010 ft
Contour interval = 40ft
BFE = 1010+40/2 = 1030 ft Highest perimeter point: Zone A Boundary = 1021 ft 1021-1010 = 11 ft OK (11<40/2)
SLIDE 22
Zone A Workshop Outline
I. Sources of Flood and Watershed Information II. How to Determine BFE: Simple Methods
Detailed Methods
III. Example of Determining Zone A BFE IV. Questions and Answers
SLIDE 23 Steps to Determine BFE
100-year discharge (flow, ft3/s)
- 2. Survey: river and structures
- 3. Hydraulics:
compute water elevation (BFE)
SLIDE 24 Rivers and streams may be:
Regulated or Unregulated
Hydrology: 100-yr flow
Gaged or Ungaged
USGS Streamstats
SLIDE 25 Three common approaches:
- Discharge / Drainage area
- Generalized equations
(USGS Streamstats)
Hydrology: 100-yr flow
SLIDE 26 Discharge / Drainage Area
10 Drainage area (mi2) Peak Discharge (ft3/s) 1 100 10,000 1,000
x
SLIDE 27 Generalized Equations
Rational Formula Q = C * i * A Regression Equation Q = 153A0.865 L-0.336 E0.125 Y-0.420
Q = discharge, C = coefficient, i = rainfall intensity, A = drainage area L = % lakes/ponds, E = % elevation >1200ft, Y = latitude factor
SLIDE 28
Hydrology: 100-yr flow
SLIDE 29
Hydrology: 100-yr flow
SLIDE 30 Hydrology: 100-yr flow
Waits River Waits River
VERMONT VERMONT N E W H A M P S H I R E N E W H A M P S H I R E
SLIDE 31 StreamStats StreamStats
Basin Characteristics Report
Date: Fri Sep 12 2008 09:03:29 Latitude (NAD83): 43.9886 (43 59 19) Longitude (NAD83): -72.1495 (-72 08 58)
Parameter Value Area in square miles 145 Mean annual precipitation in inches 40.4 Y coordinate of the centroid in map coordinates 174949.7 Percent of area covered by lakes and ponds 0.15 High Elevation I ndex - Percent of area with elevation > 1200 ft 67.1
Hydrology: 100-yr flow
SLIDE 32 Streamflow Statistics
90-Percent Prediction I nterval Statistic Flow (ft3/ s) Prediction Error (percent) Equival ent years of record Minimum Maximum
Q2 4000 42 1.4 2080 7680 Q5 5810 40 2.3 3070 11000 Q10 7150 41 3.2 3740 13700 Q25 8990 42 4.6 4680 17300 Q50 10400 43 5.5 5360 20300 Q100 11900 44 6.3 5990 23800 Q500 15700 49 7.6 7360 33600
StreamStats StreamStats
Streamflow Statistics Report
Site Location: Vermont Latitude: 43.9886 Longitude: -72.1495 Drainage Area: 145 mi2
Hydrology: 100-yr flow
SLIDE 33
Hydrology: 100-yr flow
SLIDE 34
Hydrology: 100-yr flow
at USGS gaging station
SLIDE 35
SLIDE 36
SLIDE 37
USGS Gaging Stations in New Hampshire and Vermont
SLIDE 38 Watershed Models
NRCS: TR-55, TR-20 Corps of Engineers: HEC-1
Input Input data needed include:
- Watershed characteristics (area, slope, land cover, soils)
- Channel conveyance (slope, shape, roughness)
- 100-yr rainfall intensity
- Flood storage
- Structures (dams, bridges)
Output Output data is:
- Flood hydrograph (peak = 100-yr discharge)
SLIDE 39 Flood Hydrograph
Time Flow
100-year peak discharge 100-year discharge volume
SLIDE 40 Steps to Determine BFE
100-year discharge (flow, ft3/s)
2.Survey: river and structures
compute water elevation (BFE)
SLIDE 41
- Vertical datum
- River cross sections
Number, elevations & distances
Manning’s “n”
Dams, bridges, culverts
Field Survey
SLIDE 42 Vertical Datum
NGVD29 NGVD29
National Geodetic Vertical Datum of 1929
NAVD88 NAVD88
North American Vertical Datum of 1988
- Tie all survey points to known Reference Mark (RM)
SLIDE 43
Vertical Datum
SLIDE 44
Vertical Datum
SLIDE 45
Vertical Datum
SLIDE 46 Vertical Datum on FEMA’s County DFIRMs in NH
- National Geodetic Vertical Datum
National Geodetic Vertical Datum (NGVD) of 1929 (NGVD) of 1929
– Grafton – Strafford – Rockingham
- North American Vertical Datum
North American Vertical Datum (NAVD) of 1988 (NAVD) of 1988
– Cheshire – Hillsborough (prelim) – Sullivan – Merrimack (prelim)
SLIDE 47
- Vertical datum
- River cross sections
Number, elevations & distances
Manning’s “n”
Dams, bridges, culverts
Field Survey
SLIDE 48 River Cross Sections
- Minimum 1 x-sec for small lot
Uniform flow, no obstructions
- Minimum 2 x-secs for large lots
< 500 ft between x-secs if ΔWSE > 1 ft
SLIDE 49 River Cross Sections
- Represent channel changes
Slope, shape, roughness
Tributary inflow
SLIDE 50 20 40 60 80 100 120 140 160 180 670 675 680 685 690 695 700 705
Stowe, VT LMMP Plan: Imported Plan 01 9/16/2003
A2 Station (ft) Elevation (ft) Legend EG PF 3 WS PF 3 Ground Bank Sta .04 .05 .08
River Cross Section
SLIDE 51 River Cross Sections
24049 23598 23470 23152 22390
Stowe, VT LMMP Plan: Imported Plan 01 9/16/2003
Legend WS PF 3 Ground Bank Sta Ineff
SLIDE 52
- Vertical datum
- River cross sections
Number, elevations & distances
Manning’s “n”
Dams, bridges, culverts
Field Survey
SLIDE 53 Field Survey: n values
Take photos and notes
SLIDE 54
Field Survey: n values
SLIDE 55
Field Survey
n = 0.026
SLIDE 56
Field Survey
n = 0.033
SLIDE 57
Field Survey
n = 0.043
SLIDE 58
Field Survey
n = 0.052
SLIDE 59
- Vertical datum
- River cross sections
Number, elevations & distances
Manning’s “n”
Dams, bridges, culverts
Field Survey
SLIDE 60 Field Survey: Bridges
Approach & Exit
Dimensions Roadway Wingwall Piers, Skew
SLIDE 61
Field Survey: Bridges
SLIDE 62
Field Survey: Culverts
SLIDE 63
Field Survey: Culverts
SLIDE 64 Field Survey: Culverts
Exit (& approach)
H x W x L Material & Type Slope (elevations) Entrance shape
wingwalls, mitered, rounding
Roadway
SLIDE 65 Field Survey: Dams
- Sluice gates, Flashboards, Spillway, Turbines
- Flow Regulation
- Standard Operating Procedures
SLIDE 66 Steps to Determine BFE
100-year discharge (flow, ft3/s)
- 2. Survey: river and structures
3.Hydraulics: compute water elevation (BFE)
SLIDE 67
- Normal & Critical Depths
- Step Backwater
Quick2, HEC-RAS
Weir and Conduit Flow
Hydraulics: Base Flood Elevation
SLIDE 68 Hydraulics: Normal Depth
- Uniform, Steady Flow
- No Obstructions
- Water Surface parallel to Bed Slope
1.49 A R⅔ S½ Q = n
d1 d2 v1 v2
Manning Equation:
d1 = d2 v1 = v2
SLIDE 69 Hydraulics: Critical Depth
- Minimum specific energy
- Deeper is sub-critical flow (slow)
- Shallower is super-critical flow (fast)
SLIDE 70 Hydraulics: Supercritical Flow
Hv < ½ Dh Hv > ½ Dh
BFE ≥ Critical Depth
SLIDE 71
- Steady, Non-Uniform Flow
- Water Surface not parallel to Bed Slope
Hydraulics: Step Backwater
d1 d2 v1 v2
d1 ≠ d2 v1 ≠ v2
SLIDE 72
- Start with known depth downstream
normal depth, weir flow, etc.
- Then work upstream step-by-step
compute energy & depth at each cross section
- Based on energy losses between cross-sections
f f (distance, slope, roughness, etc.)
Hydraulics: Step Backwater
12500 13000 13500 14000 14500 650 660 670 680 690
Stowe, VT LMMP Plan: Imported Plan 01 9/16/2003
Main Channel Distance (ft) Elevation (ft) Legend EG PF 3 WS PF 3 Crit PF 3 Ground Little River Little River
Quick2, HEC-RAS
SLIDE 73
- Normal & Critical Depths
- Step Backwater
Quick2, HEC-RAS
Weir and Conduit Flow
Hydraulics: Base Flood Elevation
SLIDE 74
Hydraulics: Bridges
SLIDE 75 Hydraulics: Bridges
Flow over roadway and/or bridge deck Weir Flow
Q = k C b H1.5
K = submergence factor C = weir coefficient b = weir width H = water height above weir crest
SLIDE 76 Hydraulics: Bridges
Flow through opening
- Energy Losses from Contraction & Expansion
- Wingwall design, channel cross sections
- Computer model (e.g. HEC-RAS)
SLIDE 77 100 200 300 400 680 690 700 710 720 730
Stowe, VT LMMP Plan: Imported Plan 01 9/16/2003
Bridge #1 Station (ft) Elevation (ft) Legend EG PF 3 WS PF 3 Crit PF 3 Ground Bank Sta .06 .05 .06
Hydraulics: Bridges
SLIDE 78 Hydraulics: Culverts
Tranquil flow throughout
Q = CA3√2g(h1+α1(v1
2/2g)-h3-hf1.2-hf2.3)
SLIDE 79 Hydraulics: Culverts
Critical depth at outlet
Q = CAc√2g(h1+α1(v1
2/2g)-dc-hf1.2-hf2.3
SUPER-CRITICAL
SLIDE 80 Submerged Inlet (rapid flow)
Hydraulics: Culverts
Q = CA0√2g(h1-z)
SLIDE 81 Hydraulics: Culverts
Submerged
Q = CA0√2g(h1-h4)/(1+29C2n2L/R0
4/3)
SLIDE 82 Hydraulics: Culverts
Flow over roadway
Q = CA0√2g(h1-h4)/(1+29C2n2L/R0
4/3) + kCbH3/2
SLIDE 83
Zone A Workshop Outline
I. Sources of Flood and Watershed Information II. How to Determine BFE: Simple Methods Detailed Methods
III. Example of Determining Zone A BFE
IV. Questions and Answers
SLIDE 84 Example: Normal Depth BFE
20 40 60 80 100 120 140 160 180 670 675 680 685 690 695 700 705
Stowe, VT LMMP Plan: Imported Plan 01 9/16/2003
A2 Station (ft) Elevation (ft) Legend EG PF 3 WS PF 3 Ground Bank Sta .04 .05 .08
At water depth of 12.17 ft:
- WSE = 684.67 ft (NGVD29)
- A (X-sec Area) = 807.28 ft2
- P (Wetted Perimeter) = 92.33 ft
- R (Hydraulic Radius) = 8.743 ft
- Q (Discharge) = (1.486 A R⅔S½)/n
= 7200 ft3/s Channel slope = 0.005 Manning’s n = 0.05
Q100 = 7,200 ft3/s
Hv (Velocity Head) = v2/2g = 1.25 ft ½ Dh = ½ (A/Wt) = 4.84 ft Hv < ½ Dh subcritical flow
SLIDE 85
Zone A Workshop
How to determine Base Flood Elevation (BFE)
? ? ? ? ? ? ? ? ?