
SLIDE 1
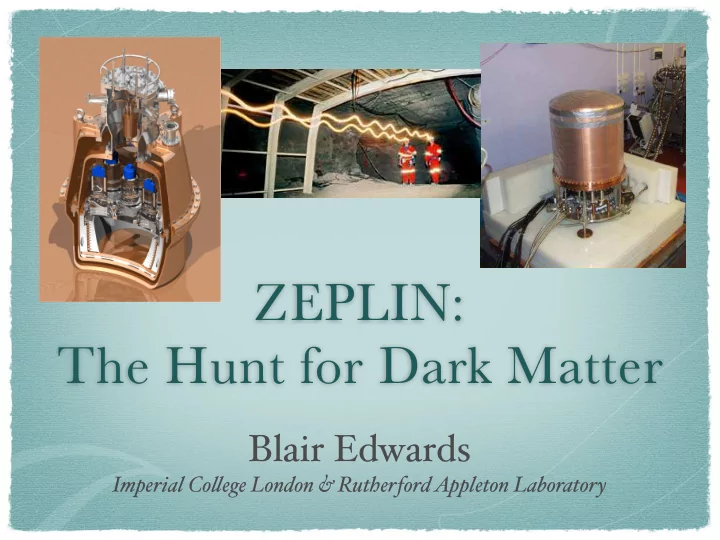
ZEPLIN: The Hunt for Dark Matter
Blair Edwards
Imperial Coege London & Rutherford Appleton Laboratory
ZEPLIN: The Hunt for Dark Matter Blair Edwards Imperial Co ege - - PowerPoint PPT Presentation
ZEPLIN: The Hunt for Dark Matter Blair Edwards Imperial Co ege London & Rutherford Appleton Laboratory Dark Matter Why?? Most of our Universe is missing . What is the other 95 % made of? All current evidence is from the
Imperial Coege London & Rutherford Appleton Laboratory
Why?? Most of our Universe is “missing”. What is the other 95% made of? All current evidence is from the gravitational effects DM has on baryonic matter we can observe. WIMPs are best motivated candidate for CDM.
Interaction with Xenon atom
Ionisation electrons drifted to extraction region by electric field
Xe* +Xe Xe2
*
Triplet 27ns Singlet 3ns
2Xe 2Xe
175nm 175nm
Xe** + Xe Xe2
+
+e-
(recombination)
Xe+ +Xe
Ionisation Excitation Electron/nuclear recoil
140 mm ~85 µs S1
S2
Interaction with Xenon atom
Ionisation electrons drifted to extraction region by electric field
Xe* +Xe Xe2
*
Triplet 27ns Singlet 3ns
2Xe 2Xe
175nm 175nm
Xe** + Xe Xe2
+
+e-
(recombination)
Xe+ +Xe
Ionisation Excitation Electron/nuclear recoil
140 mm ~85 µs S1
S2
Scintillation Primary (S1) Ionization Secondary (S2)
Searching for very rare and small signals requires a very low background. To achieve this the detector is located within a shielding castle, in the Palmer UG lab at Boulby mine. After a commisioning period, a 31-day high- quality data set was acquired. A blinded analysis procedure was carried out, meaning only 10% of the background data was available for detector characterisation.
Signal (AmBe) and Background (60Co) Calibrations
1 10 10 2 5 10 15 20 25 30 35 40 energy, keVee S2/S1
search-box set. Difference in S2/S1 ratio provides discrimination power.
background population observed from Rn progeny events located at the walls of the detector.
and background data.
e observed 29 events with a total expectation of 28.6 ± 4.3 events.
MD= 65 GeV .
1 10 10 2 0.1 0.2 0.3 0.4 0.5 0.6 0.7 0.8 0.9 1 1.1 1.2
21.88 / 18 constant 133.7 4.588 mean 0.7272 0.2989E-02 sigma 0.1056 0.2616E-02radius, a.u events/bin
1 10 10 2log(S2/S1) 5-10keVee log(S2/S1) 5-10keVee
Limit Plot
WIMP Mass [GeV/c2] Cross-section [cm2] (normalised to nucleon) 10
1
10
2
10
3
10
10
10
10
10
10
Roszkowski/Ruiz de Austri/Trotta 2007, CMSSM Markov Chain Monte Carlos (mu>0): 95% contour Roszkowski/Ruiz de Austri/Trotta 2007, CMSSM Markov Chain Monte Carlos (mu>0): 68% contour XENON10 2007 (Net 136 kg-d) CDMS 2008 Ge CDMS (Soudan) 2004 + 2005 Ge (7 keV threshold) ZEPLIN II (Jan 2007) result ZEPLIN I (2005) DATA listed top to bottom on plot
“First Limits on WIMP nuclear recoil signals in ZEPLIN-II...” G.J. Alner et al., Astroparticle Physics 28 (2007) 287-302
2 4 6 8 10 12 14 16 1.2 1.3 1.4 1.5 1.6 1.7 1.8 1.9 2
This work Fonseca et al. (2004) [14] Aprile et al. (2004) [15]
Pressure, bar Mean Single Electron Response, phe
5 5.5 6 6.5 7 7.5
Xe Number Density (x1025 m-3)
First quantitative measurements of single ionisation electron emission in noble liquid detectors. Agreement of signal size with predictions from electroluminescence yield measurements provides strong evidence.
0.5 1 1.5 2 2.5 3 3.5 4 10 20 30 40 50
Energy, keV Electron rate, %
Radial and depth distributions suggest source/production throughout the bulk of the liquid. Clear link between number of scintillation photons and rate of single electron production. ➙ Likely source: Photoionisation What is being photoionised? Most probable candidates are impurities in the liquid. Although, none can be confirmed or ruled out.
“Measurement of single electron emission in two-phase xenon”
(submitted to Astroparticle Phys.)
Alpha emanation from Getters
time constants calculated.
SAES getters.
test. S1-S2 Anti-correlation
S2 signals to improve energy
inelastic feature from AmBe.
Same operating principle as ZEPLIN-II, but with high-field operation and surface-free geometry. 31 PMTs in the liquid phase provide better precision position reconstruction and better light yield. Low-background components and construction throughout. Ultra low background PMT upgrade in preparation. Detector fully shielded, with calibration source delivery system and detector levelling mechanism.
Size of secondary signal as a function of electric field can be predicted from parameterisations
Preliminary dataset to test this shows excellent agreement with prediction. Preliminary AmBe and 137Cs calibrations appear to show improved separation of populations at higher field.
Size of secondary signal as a function of electric field can be predicted from parameterisations
Preliminary dataset to test this shows excellent agreement with prediction. Preliminary AmBe and 137Cs calibrations appear to show improved separation of populations at higher field.
Size of secondary signal as a function of electric field can be predicted from parameterisations
Preliminary dataset to test this shows excellent agreement with prediction. Preliminary AmBe and 137Cs calibrations appear to show improved separation of populations at higher field.
First science data run underway. ~300 kg.days
kg.days will be collected. Aim: reach ~1 x 10⁻⁷ pb level. Daily monitoring carried out for detector tilt, energy calibrations, background rates and xenon purity.
One tonne day of raw data collected, giving final exposure of 225 kg.days.
.
future experiments: Single electron emission, alpha emanation and S1/S2 anti-correlation.
science run underway, with ~300 kg.days of data acquired so far.
energy, keVee relative rate, keVee-1
Am-Be CAL/GEANT4 Co-60 CAL/GEANT4 Calculated
Scintillation Electroluminescence
Radius
57Co Energy and
Position Calibrations
calibrations and an unblinded sample of background data.
centroid method, giving resolution of about 1 cm.
calculated.