
SLIDE 1
“Yours is better!”
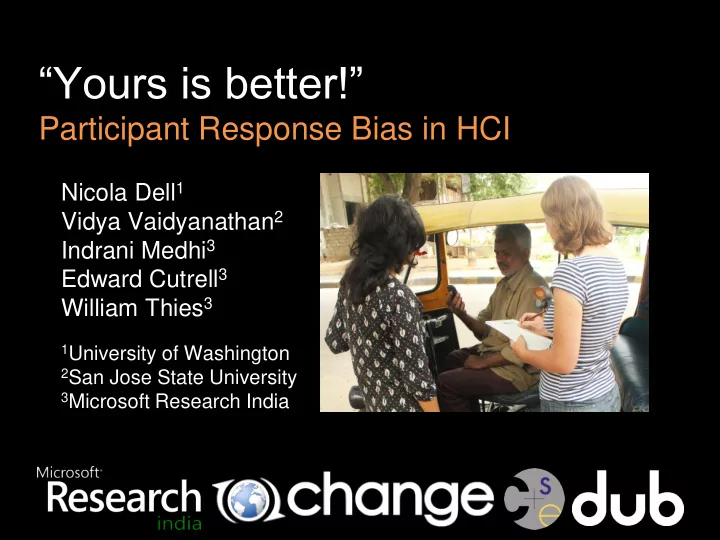
Participant Response Bias in HCI
Nicola Dell1 Vidya Vaidyanathan2 Indrani Medhi3 Edward Cutrell3 William Thies3
1University of Washington 2San Jose State University 3Microsoft Research India
Yours is better! Participant Response Bias in HCI Nicola Dell 1 - - PowerPoint PPT Presentation
Yours is better! Participant Response Bias in HCI Nicola Dell 1 Vidya Vaidyanathan 2 Indrani Medhi 3 Edward Cutrell 3 William Thies 3 1 University of Washington 2 San Jose State University 3 Microsoft Research India HCI is expanding and
1University of Washington 2San Jose State University 3Microsoft Research India
2
3
4
5
6
7
8
9
10
11
12
13
14
15
16
17
35 7 8
10 20 30 40 50
Number of people
Preferred interviewer’s video Preferred other video Thought videos looked the same
18
19 9 22
10 20 30 40 50
35 7 8
10 20 30 40 50
Number of people
Number of people
Preferred interviewer’s video Preferred other video Thought videos looked the same
19
20
21
21
21
21
22
4 38 8
10 20 30 40 50
Preferred low-quality video Preferred high-quality video Thought videos looked the same
23
Number of people
Preferred low-quality video Preferred high-quality video Thought videos looked the same
23
Number of people 27 19 4
10 20 30 40 50
Number of people 4 38 8
10 20 30 40 50
24
25
26
27
28
29
30
30
30
32
33
34
35
36
37
38
39
40
41
42
1University of Washington 2San Jose State University 3Microsoft Research India
nixdell@uw.edu http://cs.washington.edu/homes/nixdell