Y P TMS in animal models: O Methods and Applications C T O - - PowerPoint PPT Presentation

y p
SMART_READER_LITE
LIVE PREVIEW

Y P TMS in animal models: O Methods and Applications C T O - - PowerPoint PPT Presentation

Y P TMS in animal models: O Methods and Applications C T O Electric current Magnetic N field Electric Coil field O D E S A E Alexander Rotenberg, M.D., Ph.D. L P Director, Neuromodulation Program Boston Childrens Hospital Y


slide-1
SLIDE 1

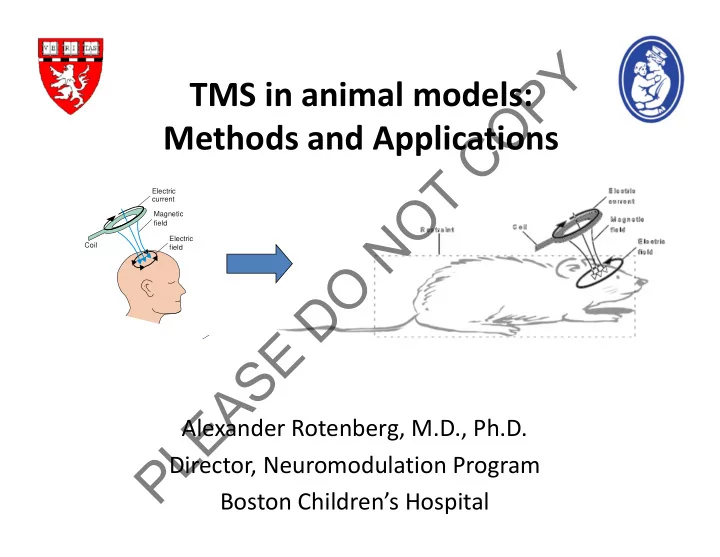
TMS in animal models: Methods and Applications

Alexander Rotenberg, M.D., Ph.D. Director, Neuromodulation Program Boston Children’s Hospital

Coil Electric field Magnetic field Electric current

P L E A S E D O N O T C O P Y

slide-2
SLIDE 2

TMS in animals

P L E A S E D O N O T C O P Y

slide-3
SLIDE 3

Why TMS studies in animals?

– Basic Science – Translational Research

Poma et al., 2006

P L E A S E D O N O T C O P Y

slide-4
SLIDE 4

Advantages of animal subject

  • Subject homogeneity
  • Available histology
  • Genetic / disease models

Liebetanz et al., 2003

P L E A S E D O N O T C O P Y

slide-5
SLIDE 5

Translational Relevance

  • Disease modeling
  • TMS safety
  • Neuronal connectivity
  • Synaptic plasticity
  • Cortical organization

Charlet de Sauvage et al. 2007

P L E A S E D O N O T C O P Y

slide-6
SLIDE 6

No injury after prolonged TMS

  • Counter, 1995:

– No deleterious effect on AEP after 1000 pulses at 1Hz n rabbits

  • Nishikiori, 1996:

– No cortical or brainstem lesions after ~1 month of daily TMS in rabbits

  • Liebetanz et al., 2003:

– No MRS or histologic changes after 5 days of 1 Hz rTMS

  • Charlet de Sauvage et al., 2007

– No DNA damage after 2000 TMS pulses

P L E A S E D O N O T C O P Y

slide-7
SLIDE 7

Induced dysfunction: neglect following rTMS in cats

Valero Cabre et al., 2005

P L E A S E D O N O T C O P Y

slide-8
SLIDE 8

Frequency‐Dependent 14C‐2DG uptake modulated in cat

Valero-Cabre et al. 2006 20 Hz off-line 20 Hz on-line 1 Hz on-line

P L E A S E D O N O T C O P Y

slide-9
SLIDE 9

Most translational research is with rodents

  • Well‐described disease models
  • Inexpensive
  • Experiments may be translated to clinical care
  • TMS effect can be examined at multiple levels:

whole animal, brain slice, single cell, etc.

Kistsen et al., in progress

P L E A S E D O N O T C O P Y

slide-10
SLIDE 10

Disadvantages of rat model

– Compromised stimulus focality – Slightly more difficult EEG – Required restraint or anesthesia

Luft et al., 2001 Kamida et al., 1998

P L E A S E D O N O T C O P Y

slide-11
SLIDE 11

Stimulation protocols

Frye, Rotenberg, et al. Child Neurol 2007

P L E A S E D O N O T C O P Y

slide-12
SLIDE 12

Off‐Center Coil

Rotenberg et al., 2009 EMG EMG Ground

P L E A S E D O N O T C O P Y

slide-13
SLIDE 13

Lateralized brachioradialis MEP

P L E A S E D O N O T C O P Y

slide-14
SLIDE 14

TMS in a Deployable Automated Anesthesia Unit (DAAU)

Roteberg, Goldie, Leroy (Vivonics Inc., and Boston Children’s Hospital)

P L E A S E D O N O T C O P Y

slide-15
SLIDE 15

Proposed use: a closed loop autonomous analgesia system

Roteberg, Goldie, Leroy (Vivonics Inc., and Boston Children’s Hospital)

P L E A S E D O N O T C O P Y

slide-16
SLIDE 16

‐0.8 ‐0.7 ‐0.6 ‐0.5 ‐0.4 ‐0.3 ‐0.2 ‐0.1 0.1 1 3 5 7 9 11 13 15 17 19 21 23 25 27 29 31 33 35 37 39 41 43 45 47 49 51 53 55 57 59

Control 10mg 20mg

MEP response to propofol bolus

MEP amplitude change (Log %baselne) Gersner et al., in progress

P L E A S E D O N O T C O P Y

slide-17
SLIDE 17

MEP response to propofol rate change

MEP amplitude change (Log %baselne)

‐0.8 ‐0.7 ‐0.6 ‐0.5 ‐0.4 ‐0.3 ‐0.2 ‐0.1 0.1 0.2 1 4 7 10 13 16 19 22 25 28 31 34 37 40 43 46 49 52 55 58 61 64 67 70 73 76 79 82 85 88 91 94 97 100 103

Log‐transformed

Control 2to1

P L E A S E D O N O T C O P Y

slide-18
SLIDE 18

Stimulation protocols

Frye, Rotenberg, et al. Child Neurol 2007

P L E A S E D O N O T C O P Y

slide-19
SLIDE 19

1

Conditioning TMS 2 Test TMS

50 ms

Paired-pulse MEP inhibition

GABAergic cortical inihibition measures by paired‐pulse TMS (ppTMS)

Rotenberg and Pascual-Leone, 2010

GABA-mediated inhibition

P L E A S E D O N O T C O P Y

slide-20
SLIDE 20

MMG (Mechanomyography)

Accelerometer

P L E A S E D O N O T C O P Y

slide-21
SLIDE 21

EMG vs MMG

MMG (V)

  • 0.15
  • 0.10
  • 0.05

0.00 0.05 0.10 0.15 50ms

60%MO 70%MO 80%MO 90%MO 100%MO

MMG

Input–output curve of MMG

EMG (Tibia anterior m.)

P L E A S E D O N O T C O P Y

slide-22
SLIDE 22

GABAA‐mediated cortical inhibition following pentobarbital (PB) and pentylenetetrazole (PTZ)

200ms ISI

Condition

Pre P10 P60 Pre P10 P60 Pre P10 P60

% of unconditioned MMG

20 40 60 80 Saline PB PTZ

Left Right Ave (L+R)

*** * *** * *** *

reduced inhibition with PTZ and increased inhibition with PB

P L E A S E D O N O T C O P Y

slide-23
SLIDE 23

TBI: The most common cause of acquired epilepsy in young adults Causes of Epilepsy:

Annegers JF. Lippincott Williams & Wilkins, 2001:165-72.

(PTE)

P L E A S E D O N O T C O P Y

slide-24
SLIDE 24

P L E A S E D O N O T C O P Y

slide-25
SLIDE 25

Fluid Percussion Injury: a post‐traumatic epilepsy model

Nature Protocols, 2011 McIntosh et al., 1989

P L E A S E D O N O T C O P Y

slide-26
SLIDE 26

200ms ISI

Time

Pre 1WK 2WKS 3WKS 4WKS 5WKS 6WKS

Ratio

0.0 0.2 0.4 0.6 0.8 1.0 Sham control TBI

** * * * * *

Loss of cortical paired‐pulse inhibition after TBI

P L E A S E D O N O T C O P Y

slide-27
SLIDE 27

4 2 Sham control TBI (lesion) 4 2 6 6

NeuN

4 2 TBI (contra-lesion) 6 I II/III V VI

General cortical architecture is not affected by TBI

NeuN Hsieh et al., Cerebral Cortex 2016

P L E A S E D O N O T C O P Y

slide-28
SLIDE 28

Gonchar et al., 2007, Front Neuroanat.

Parvalbumin (PV) interneurons are the major sub-type of cortical inhibitory neuron… and vulnerable to oxidative stress

P L E A S E D O N O T C O P Y

slide-29
SLIDE 29

4 2 Sham control Post-TBI (peri-lesion) 4 2 6 6

PV

4 2 Post-TBI (contra-lesion) 6 I II/III V VI * *** *** * n.s. n.s. Peri-lesion Contra-lesion

Progressive PV loss after TBI

P L E A S E D O N O T C O P Y

slide-30
SLIDE 30

8-oxo-dG

I II/III V VI 4 2 Sham control Post-TBI (peri-lesion) 4 2 6 6 4 2 Post-TBI (contra-lesion) 6

n.s. *** *** ** n.s. n.s. Peri-lesion Contra-lesion

Delayed increase in oxidative stress after TBI

(8-oxo-DG)

P L E A S E D O N O T C O P Y

slide-31
SLIDE 31

Disruption of perineuronal nets (PNN) after TBI

P L E A S E D O N O T C O P Y

slide-32
SLIDE 32

P L E A S E D O N O T C O P Y

slide-33
SLIDE 33

Ceftriaxone treatment prophylaxes against posttraumatic seizures

P L E A S E D O N O T C O P Y

slide-34
SLIDE 34

ppTMS as a biomarker in TBI treatment

Hameed et al., in progress

P L E A S E D O N O T C O P Y

slide-35
SLIDE 35

Ipsilesional Parvalbumin Expression after TBI

2 weeks 4 weeks 6 weeks * * * p<0.05

P L E A S E D O N O T C O P Y

slide-36
SLIDE 36

Implications for Therapy TBI Epileptic seizure PTE

Antioxidant (N‐acetylcysteine) Oxidative stress Loss of PV‐cells ↓ Perineuronal nets ↓ Otx2 Impaired inhibition Neuroprotection (Otx2) Lee et al., 2013

P L E A S E D O N O T C O P Y

slide-37
SLIDE 37

Stimulation protocols

Frye, Rotenberg, et al. Child Neurol 2007

P L E A S E D O N O T C O P Y

slide-38
SLIDE 38

P L E A S E D O N O T C O P Y

slide-39
SLIDE 39

Rat “deep” TMS during seizure

EEG analysis (seizure detection) coil electric current magnetic field electric field torso strap restraints

P L E A S E D O N O T C O P Y

slide-40
SLIDE 40

rTMS during KA seizure

Rotenberg et al., Clin Neurophys 2008

P L E A S E D O N O T C O P Y

slide-41
SLIDE 41

rTMS during KA seizures

Relative Average Seizure Duration (% untreated control) 0.25 Hz

0% 25% 50% 75% 100% 125% 150%

0.5 Hz

*

0.75 Hz

untreated sham active

*

untreated sham active untreated sham active

Rotenberg et al., 2008

P L E A S E D O N O T C O P Y

slide-42
SLIDE 42

Combination therapy: lorazepam + rTMS in seizure suppression

½ LZP + Sham ½ LZP + ½ LZP ½ LZP + rTMS 2nd treatment Baseline LZP Follow-up 30 sec

0.2 0.4 0.6 0.8 1 1.2 1.4 BL 1st 2nd FU Normalized spike frequency (auto-count)

Baseline LZP Follow-up 2nd Treatment

** ***

Gersner et al., 2016.

½ LZP + sham TMS ½ LZP + ½ LZP ½ LZP + rTMS

P L E A S E D O N O T C O P Y

slide-43
SLIDE 43

Better seizure suppression in humans with 1 Hz

  • 0. 3
  • 0. 5

1

  • 100
  • 50

50 100 150 c h a n g e H z

Rotenberg et al., unpublished data % reduction in Seizure Frequency After rTMS

P L E A S E D O N O T C O P Y

slide-44
SLIDE 44

Frequency‐response in vitro LTD approximates rTMS data

Nakano et al., 2004

P L E A S E D O N O T C O P Y

slide-45
SLIDE 45

Molecular Basis: Does rTMS induce LTP/LTD?

Kandel, 2001

P L E A S E D O N O T C O P Y

slide-46
SLIDE 46

Muller et al., PLOS One 2014

*

1 0.5 0.25 S1 S0.5 S0.25

Stimulation Condition (Hz)

Can 1 Hz TMS suppresses motor excitability rats anesthetized with pentobarbital?

Reduced cortical excitability

P L E A S E D O N O T C O P Y

slide-47
SLIDE 47

P L E A S E D O N O T C O P Y

slide-48
SLIDE 48

Kandel, 2001

rTMS mechanisms

P L E A S E D O N O T C O P Y

slide-49
SLIDE 49

CREB phosphorylation by 20 Hz rTMS

0% 50% 100% 150% 200% 250% 300%

20 Hz rTMS Sham

pCREB (% control) 20 Hz rTMS Sham

P L E A S E D O N O T C O P Y

slide-50
SLIDE 50

Kandel, 2001

rTMS mechanisms

P L E A S E D O N O T C O P Y

slide-51
SLIDE 51

BDNF expression after rTMS

anesthetized awake Gersner et al., J. Neursci 2011

P L E A S E D O N O T C O P Y

slide-52
SLIDE 52

Gersner et al., J. Neursci 2011

GluR1 expression and phosphorylation after rTMS

P L E A S E D O N O T C O P Y

slide-53
SLIDE 53

P L E A S E D O N O T C O P Y

slide-54
SLIDE 54

Can we model TMs in rodents without magnetic coils?

Hsieh et al., work in progress

P L E A S E D O N O T C O P Y

slide-55
SLIDE 55

LTP-like potentiation after electrical iTBS

Hsieh et al., work in progress

P L E A S E D O N O T C O P Y

slide-56
SLIDE 56

P L E A S E D O N O T C O P Y

slide-57
SLIDE 57

1 sec

MEA recording and TRANSCRANIAL FISH STIMULATION Meyer et al., SFN 2014

P L E A S E D O N O T C O P Y

slide-58
SLIDE 58

Single evoked potential

P L E A S E D O N O T C O P Y

slide-59
SLIDE 59

Stimulation: 50 µA (half max), at channel 16

P L E A S E D O N O T C O P Y

slide-60
SLIDE 60

Location of channels with EPs relative to stimulation channel

P L E A S E D O N O T C O P Y

slide-61
SLIDE 61

30 20 10

  • 10
  • 20
  • 30

Cathode Anode

No CTEP +CTEP

Layer II/III Layer V/VI

Stimulating electrode Recording electrode

P L E A S E D O N O T C O P Y

slide-62
SLIDE 62

Support: NIH NINDS; NIH NIMH Department of Defense CIMIT Epilepsy Research Foundation Citizens United for Research in Epilepsy Boston Children’s Hospital Translational Research Program Children’s Hospital Department of Neurology Al Rashed family; Siegel family; Fisher Family

Current and recent lab members

Nicolas Chiriboga Sameer Dhamne Roman Gersner Mustafa Hameed Tsung-Hsun Hsieh Harper Kaye Henry Lee Richard Manfready Michaela Meyer Paul Muller Carmen Paredes Maria Sanchez Yan Sun Andrew Vahabzadeh Jingpu Zhao

Colleagues and mentors Narong Auvichayapat ‐ Khon Kaen U., Thailand Paradee Auvichayapat ‐ Khon Kaen U., Thailand Marom Bikson ‐ CCNY Blaise Bourgeois ‐ BCH Dana Ekstein – Hadassah, Israel Felipe Fregni – Spaulding Rehab / MGH Joseph Gonzalez‐Heydrich ‐ BCH Takao Hensch ‐ BCH Frances Jensen – U Penn Anli Liu ‐ NYU Tobias Loddenkemper – BCH Joseph Madsen ‐ BCH Alvaro Pascual‐Leone – BIDMC Phil Pearl ‐ BCH Ann Poduri ‐ BCH James Riviello ‐ Columbia Paul Rosenberg – BCH Mustafa Sahin ‐ BCH Steve Schachter – CIMIT / BIDMC Don Schomer – BIDMC Mo Shafi ‐ BIDMC Masanori Takeoka ‐ BCH Abraham Zangen – BGU, Israel

Thanks!

P L E A S E D O N O T C O P Y