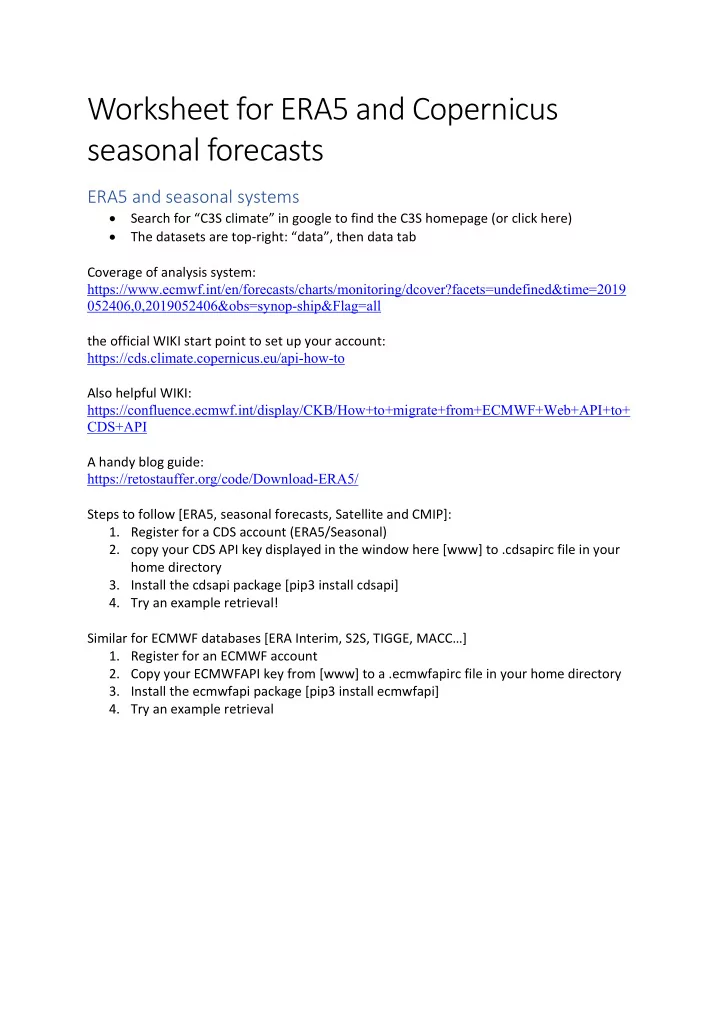

Worksheet for ERA5 and Copernicus seasonal forecasts ERA5 and seasonal systems • Search for “C3S climate” in google to find the C3S homepage (or click here) • The datasets are top-right: “data”, then data tab Coverage of analysis system: https://www.ecmwf.int/en/forecasts/charts/monitoring/dcover?facets=undefined&time=2019 052406,0,2019052406&obs=synop-ship&Flag=all the official WIKI start point to set up your account: https://cds.climate.copernicus.eu/api-how-to Also helpful WIKI: https://confluence.ecmwf.int/display/CKB/How+to+migrate+from+ECMWF+Web+API+to+ CDS+API A handy blog guide: https://retostauffer.org/code/Download-ERA5/ Steps to follow [ERA5, seasonal forecasts, Satellite and CMIP]: 1. Register for a CDS account (ERA5/Seasonal) 2. copy your CDS API key displayed in the window here [www] to .cdsapirc file in your home directory 3. Install the cdsapi package [pip3 install cdsapi] 4. Try an example retrieval! Similar for ECMWF databases [ERA Interim, S2S, TIGGE, MACC…] 1. Register for an ECMWF account 2. Copy your ECMWFAPI key from [www] to a .ecmwfapirc file in your home directory 3. Install the ecmwfapi package [pip3 install ecmwfapi] 4. Try an example retrieval
A couple of tips: Tip 1, Data format : The ERA5 data can be provided in native GRIB or the request can also be made for netcdf format. If you download in grib you can convert using the command Cdo -f nc4 copy in.grb out.nc (this is problematic for forecasts data however due to the multiple time axes, for those you need gribapi or its recent replacement eccodes to have access to grib2netcdf). Install eccodes guide for linus: https://confluence.ecmwf.int/display/ECC/ecCodes+installation Install eccodes on MAC: brew unlink grib-api # if you have eccodes already brew install eccodes Tip 2, Retrieval of smaller regions : To save on download times/desk space you can opt to cut out a specific region, using the option “AREA”: [“N”,”W”,”S”,”E”], (don’t forget the trailing comma!). Tip3, Loops in retrievals: If you want to loop over a set of retrievals (e.g. one retrieval per year) then you need to know how to use a loop in python. Python enforces strict typing and good coding practise by recognising loops though indentation (usually 4 spaces), The loop ends when you return to the original indentation. You can use the range function to make a list of integers (note the last integer is NOT includes, i.e. the following example gives, 2000, 2001, 2002, 2003, 2004. for y in range(2000,2005): print(str(y)) more code outside loop You will note that all arguments need to be supplies as a list of strings in python. If you want to specify a list of strings without typing them out painstakingly, you can do this: ylist=[str(y) for y in range(2000,2005)]
Climate Data Operators (CDO) and NCO CDO is set of 150+ command-line utilities that are extremely helpful for manipulating grib/netcdf file data and calculating statistics. It has a large number of climate-related functionality in addition to basic mathematical operators. Documentation: www. Installation On Linux: sudo apt-get install cdo On MAC : brew tap moffat/sciencebits brew install cdo --with-grib2 On Windows 10 It is now possible to install pure linux ubuntu directly within windows, (not dual boot, not wineserver, and not Cygwin) – follow one of the many online blogs to see how to do this, then follow the linux instructions. Common useful functions: cdo sellonlatbox,lon1,lon2,lat1,lat2 in.nc out.nc cdo add/sub/mul/div in1.nc in2.nc out.nc cdo addc,val in.nc out.nc # c= constant, sub etc also of course cdo gec,val in.nc mask.nc # gec = greater-equal constant [gtc,gec,ltc,lec,eqc] cdo fldmean in.nc out.nc # area average cdo timmean in.nc out.nc # time average cdo monmean in.nc out.nc # mean stats over months [can use mon=months, day=days, hour=hours…] [can use mean, max, min, avg, stddev, var…] cdo percen,X in.nc out.nc # calculate Xth percentile cdo timcor in1.nc in2.nc out.nc # correlation maps cdo expand,rlonxlat in.nc out.nc # repeat a single value timeseries spatially [r360x180 = 1x1 degree regular grid ] You may use which ever software you wish to use to display the results (python, R, GRADS, ncl… etc etc ). I will be using ncview to investigate the files. If you want to make nicer looking maps without resorting to coding then you may also want to consider panoply , free from NCAR.
Exercises: ERA5 For the following exercises we will use the python api utilities combined with CDO Exercise 1: Write a python script to download the monthly Sea Surface Temperature for 1979-present from ERA5 and postprocess the fields to create a timeseries of monthly SST anomaly in the Nino 3.4 region (5N-S, 170W-120W). You may also optionally choose to detrend the series. You may use cdo to cut down the global field, or use the AREA option in the python retrieve command to obtain less data. Exercise 2: Retrieve the daily maximum 2 meter temperature in an area of interest to you for all Junes, e.g. Russia [start with just 3 years 2008-2010 to keep the file size small] and calculate the 95% percentile for June days Exercise 3: Calculate the correlation between NINO3.4 SST index and temperature and/or rainfall in a region of your interest. Exercises: Seasonal Exercise: Download monthly precipitation anomaly at lead 1 for a region of your choice for June (so lead 1 means you need to use May starts, lead0=May), you can use cdo to convert it to netcdf and then calculate an anomaly correlation using the ERA5 data precipitation.
Recommend
More recommend