Wisconsin and the Beloit Region Demographic and Labor Market - - PDF document

wisconsin and the beloit region
SMART_READER_LITE
LIVE PREVIEW

Wisconsin and the Beloit Region Demographic and Labor Market - - PDF document

12/12/2018 Wisconsin and the Beloit Region Demographic and Labor Market Overview Dennis Winters & Tom Pethan Department of Workforce Development GBEDC Annual Investors Meeting December 12th, 2018 Hotel Goodwin, Beloit, WI Projected


slide-1
SLIDE 1

12/12/2018 1

Wisconsin and the Beloit Region

Demographic and Labor Market Overview Dennis Winters & Tom Pethan

Department of Workforce Development

GBEDC Annual Investors Meeting December 12th, 2018 Hotel Goodwin, Beloit, WI

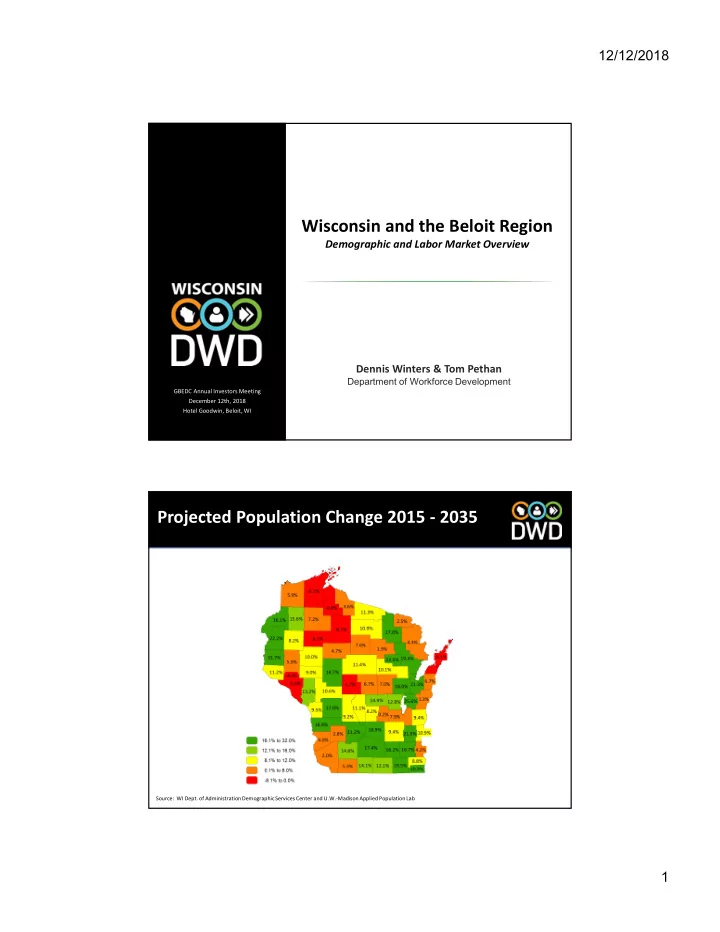
Projected Population Change 2015 - 2035

Source: WI Dept. of AdministrationDemographicServices Center and U.W.-Madison Applied Population Lab

slide-2
SLIDE 2

12/12/2018 2

Projected Population Change 2015 – 2025

People Aged 65 & Older

LFPR Declines as Workers Age

Wisconsin LFPR by Age Cohort

Source: 2016 American Community Survey (ACS), US Census; sourced from IPUMS.org

slide-3
SLIDE 3

12/12/2018 3

Wisconsin Population and Labor Force

1,000 2,000 3,000 4,000 5,000 6,000 7,000 1960 1970 1980 1990 2000 2010 2020 2030 ( x 1000 ) POPULATION CIVILIAN LABOR FORCE Source: Bureau of Labor Statistics, OEA

Wisconsin’s Workforce Growth How Employment is Tracking

slide-4
SLIDE 4

12/12/2018 4

Job Openings

There are currently 34,711 resumes and 100,429 jobs on the Job Center of Wisconsin site (11/20/18).

https://jobcenterofwisconsin.com/

County of Residence for Beloit Jobs (Top 10) Commuting

County Name Number of People who Work in Beloit (City or Town) and Live in Specified County Percentage of Beloit Workers

Source: OnTheMap, LEHD Census, 2015; Numbers show Primary Jobs

slide-5
SLIDE 5

12/12/2018 5

Job Sectors

Source: LEHD, Quarterly Workforce Indicators (QWI), 2017 Annual

Total Net Job Growth 2010-2017

Rock, WI + Winnebago, IL = 10,451 (5.9%) Wisconsin = 222,388 (8.6%)

Demographics

Source: WI Department of Administration (DOA) for Rock and Wisconsin; IL Department of Commence and Economic Opportunity (DCEO) for Winnebago (IL)

Total Projected Population Growth 2020-2030

Rock, WI + Winnebago, IL = 6.5% Wisconsin = 6.2%

slide-6
SLIDE 6

12/12/2018 6

Demographics

Source: US Census, 2017 1-YR American Community Survey (ACS); Unemployment from BLS, LAUS Program

Long-term Industry Employment Projections, 2016-2026 Industry Sector by Percent Change; SW WDA

Source: DWD, Office of Economic Advisors, November 2018

slide-7
SLIDE 7

12/12/2018 7 Long-term Occupational Employment Projections, 2016-2026 Gaining the Most New Jobs; SW WDA

Source: DWD, Office of Economic Advisors, November 2018

Long-term Occupational Employment Projections, 2016-2026 Fastest-Growing by Percent Change; SW WDA

Source: DWD, Office of Economic Advisors, November 2018 *With at least 500 employment for 2016

slide-8
SLIDE 8

12/12/2018 8 Long-term Occupational Employment Projections, 2016-2026 Most Job Openings; SW WDA

Source: DWD, Office of Economic Advisors, November 2018

WisConomy Connect with Regional Economists Find Labor Market Information

Jobs Wages Industry and Occupation Projections

slide-9
SLIDE 9

12/12/2018 9

Questions?

Dennis Winters

Chief Economist Dennis.Winters@dwd.wi.gov 608-267-3262 http://dwd.wisconsin.gov