
SLIDE 1
1
Today
Color
- Reading:
– Chapter 6, Forsyth & Ponce
- Optional reading:
– Chapter 4 of Wandell, Foundations of Vision, Sinauer, 1995 has a good treatment of this.
- Feb. 17, 2005
MIT 6.869
- Prof. Freeman
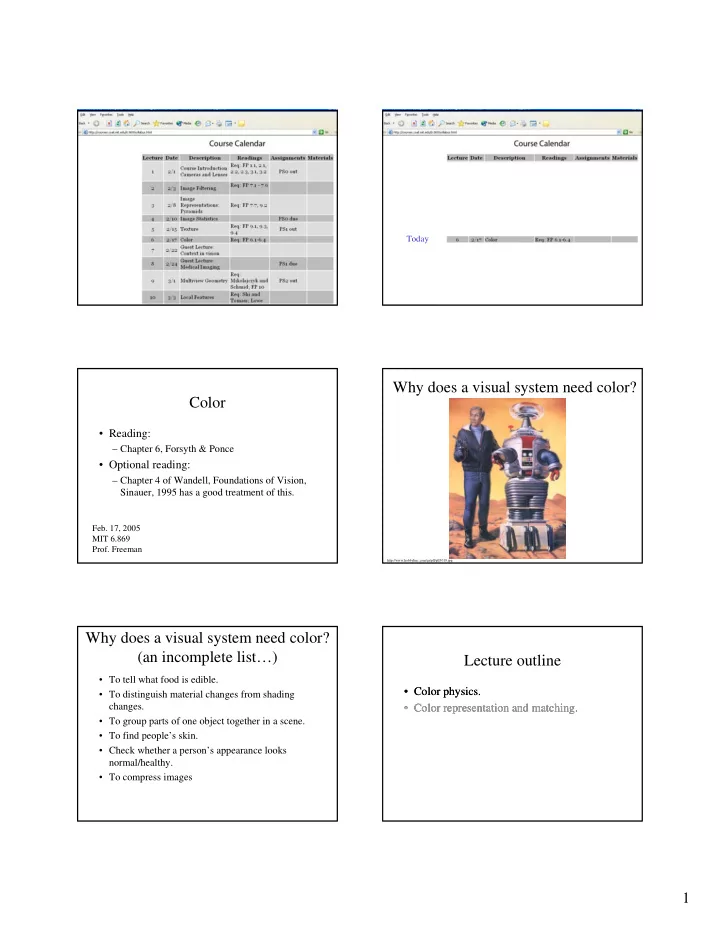
Why does a visual system need color?
http://www.hobbylinc.com/gr/pll/pll5019.jpg
Why does a visual system need color? (an incomplete list…)
- To tell what food is edible.
- To distinguish material changes from shading
changes.
- To group parts of one object together in a scene.
- To find people’s skin.
- Check whether a person’s appearance looks
normal/healthy.
- To compress images
Lecture outline
- Color physics.
- Color representation and matching.
- Color physics.
- Color representation and matching.