
SLIDE 1
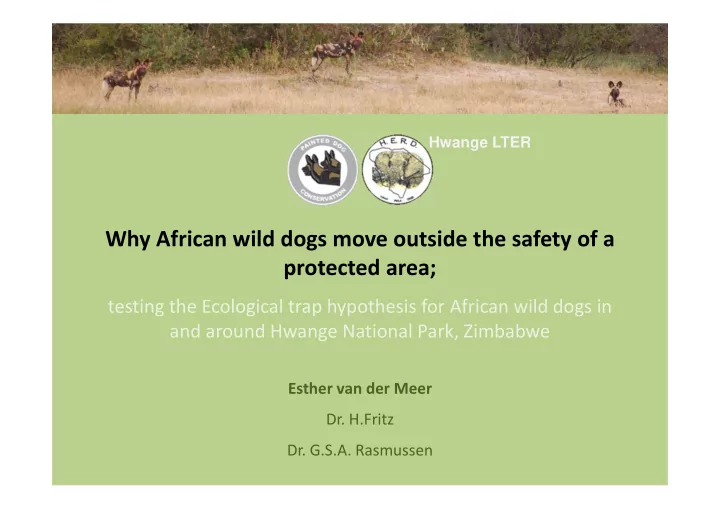
Why African wild dogs move outside the safety of a protected area;
testing the Ecological trap hypothesis for African wild dogs in and around Hwange National Park, Zimbabwe
Esther van der Meer
- Dr. H.Fritz
- Dr. G.S.A. Rasmussen
Hwange LTER