
SLIDE 1
whois My name is Vincent
Vincent D. Warmerdam - [@fishnets88] - GoDataDriven - koaning.io 1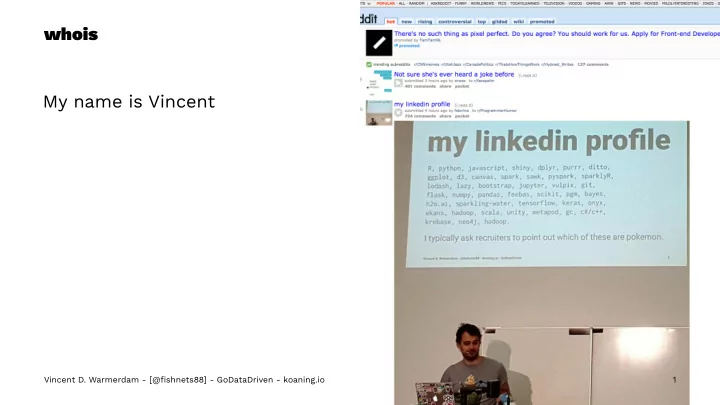
whois My name is Vincent Vincent D. Warmerdam - [@fishnets88] - - - PowerPoint PPT Presentation
whois My name is Vincent Vincent D. Warmerdam - [@fishnets88] - GoDataDriven - koaning.io 1 whois My name is Vincent I solve data problems, AMA! PyData Chair Rstudio Partner Meetup Organiser koaning.io bayesian Fan of
whois My name is Vincent
Vincent D. Warmerdam - [@fishnets88] - GoDataDriven - koaning.io 1 whois My name is Vincent I solve data problems, AMA! — PyData Chair — Rstudio Partner — Meetup Organiser — koaning.io — bayesian Fan of ING, thanks! for sponsoring ALL THE THINGS
Vincent D. Warmerdam - [@fishnets88] - GoDataDriven - koaning.io 2 WoRld of WaR-and SpaRkCRa!
Vincent D. Warmerdam - GDD - koaning.io - @fishnets88
Vincent D. Warmerdam - [@fishnets88] - GoDataDriven - koaning.io 3 AKA
This R language Python people are like dog people. R people are like cat people. The problem starts when a dog person looks at a cat expecting dog behavior. 'That is not how data science is supposed to work!' — Python User
Vincent D. Warmerdam - [@fishnets88] - GoDataDriven - koaning.io 5 'Your dog is broken.'
— Python User
Vincent D. Warmerdam - [@fishnets88] - GoDataDriven - koaning.io 6 Paraprasing. R is a language with strange parts, just like these cats that live in my house, but it more than compensates with some great parts. I love python. It is a scripting language with great taste. But I really believe that I am better in my career in the field because I've invested enough time learning other languages.
Vincent D. Warmerdam - [@fishnets88] - GoDataDriven - koaning.io 7 Today My goal is to talk about the great parts today. We'll see different backends in the mix. We'll discuss how to deal with keras/spark. We'll understand more advanced R tricks. We'll even talk about the DSL for a different breed of ML.
Vincent D. Warmerdam - [@fishnets88] - GoDataDriven - koaning.io 8 Today My goal is to talk about the great parts today. We'll see different backends in the mix. We'll discuss how to deal with keras/spark. We'll understand more advanced R tricks. We'll even talk about the DSL for a different breed of ML. There will also be special announcements at the end.
Vincent D. Warmerdam - [@fishnets88] - GoDataDriven - koaning.io 9 Today My goal is to talk about the great parts today. We'll see different backends in the mix. We'll discuss how to deal with keras/spark. We'll understand more advanced R tricks. We'll even talk about the DSL for a different breed of ML. There will also be special announcements at the end. Oh, and a fun dataset.
Vincent D. Warmerdam - [@fishnets88] - GoDataDriven - koaning.io 10 Dataset Preview
# Source: table<df> [?? x 7] # Database: spark_connection # Ordered by: char, timestamp char level race charclass zone guild timestamp <int> <int> <chr> <chr> <chr> <int> <dttm> 1 2 18 Orc Shaman The Barrens 6 2008-12-03 10:41:47 2 7 54 Orc Hunter Feralas -1 2008-01-15 21:47:09 3 7 54 Orc Hunter Un'Goro Crater -1 2008-01-15 21:56:54 4 7 54 Orc Hunter The Barrens -1 2008-01-15 22:07:23 5 7 54 Orc Hunter Badlands -1 2008-01-15 22:17:08 6 7 54 Orc Hunter Badlands -1 2008-01-15 22:26:52 7 7 54 Orc Hunter Badlands -1 2008-01-15 22:37:25 8 7 54 Orc Hunter Swamp of Sorrows 282 2008-01-15 22:47:10 9 7 54 Orc Hunter The Temple of Atal'Hakkar 282 2008-01-15 22:56:53 10 7 54 Orc Hunter The Temple of Atal'Hakkar 282 2008-01-15 23:07:25
Vincent D. Warmerdam - [@fishnets88] - GoDataDriven - koaning.io 12 Dataset Stats Data from a single World of Warcraft Server. — 37,354 players — 10,826,734 rows — min_timestamp = 2008-01-01 00:02:04 — max_timestamp = 2008-12-31 23:50:18
Vincent D. Warmerdam - [@fishnets88] - GoDataDriven - koaning.io 13 Stats Query Generating these stats in R is a breeze. For example:
df %>% summarise(maxdate = max(timestamp), mindate = min(timestamp), n_char = n_distinct(char), n = ())
Vincent D. Warmerdam - [@fishnets88] - GoDataDriven - koaning.io 14 Stats Query
df %>% summarise(maxdate = max(timestamp), mindate = min(timestamp), n_char = n_distinct(char), n = ())
There's two interesting parts in this query though. The first part is this %>% operator.
Vincent D. Warmerdam - [@fishnets88] - GoDataDriven - koaning.io 15 Modern R code: %>%-operator To get these verbs to work, it helps to explain the %>%.
money <- function(amount, interest){ amount * (1 + interest) }
Then the %>% operator makes the following statements equivalent.
money(100, 3) 100 %>% money(3)
Vincent D. Warmerdam - [@fishnets88] - GoDataDriven - koaning.io 16 Modern R code: %>%-operator Why is this such a great deal? Compare:
money(money(money(money(100, 3),1),2),1) 100 %>% money(3) %>% money(1) %>% money(2) %>% money(1)
One can be read from top to bottom, left to right ...
Vincent D. Warmerdam - [@fishnets88] - GoDataDriven - koaning.io 17 Why this is nice: keRas Yep, R has support for that nowadays.
model <- keras_model_sequential() %>% layer_input(input_shape = c(784)) %>% layer_dense(units = 256, activation = 'relu') %>% layer_dropout(rate = 0.4) %>% layer_dense(units = 128, activation = 'sigmoid') %>% layer_dropout(rate = 0.3) %>% layer_dense(units = 10, activation = 'softmax')
It is nice and readable.
Vincent D. Warmerdam - [@fishnets88] - GoDataDriven - koaning.io 18 Modern R code: dplyr The main usecase of %>% is dplyr though.
ddf %>% group_by(charclass, race) %>% summarise(n = n_distinct(char), mean_lvl = mean(level)) %>% arrange(-n)
But there is something very strange about this query. What?
Vincent D. Warmerdam - [@fishnets88] - GoDataDriven - koaning.io 19 Modern R code: dplyr
ddf %>% group_by(charclass, race) %>% summarise(n = n_distinct(char), mean_lvl = mean(level)) %>% arrange(-n)
The char and level variables are not declared anywhere!
Vincent D. Warmerdam - [@fishnets88] - GoDataDriven - koaning.io 20 Modern R code: dplyr
ddf %>% group_by(charclass, race) %>% summarise(n = n_distinct(char), mean_lvl = mean(level)) %>% arrange(-n)
The char and level variables are not declared anywhere! The internal trick that is used here is that such a code block is lazyily evaluated. We can assign context to the variables that are not declared, later.
Vincent D. Warmerdam - [@fishnets88] - GoDataDriven - koaning.io 21 Capture that AST Example of this delayed evaluation.
> expr <- quo(x + y) > rlang::eval_tidy(expr) # Error: object 'x' not found
Vincent D. Warmerdam - [@fishnets88] - GoDataDriven - koaning.io 22 Capture that AST Example of this delayed evaluation.
> expr <- quo(x + y) > rlang::eval_tidy(expr) # Error: object 'x' not found > x <- 1 > rlang::eval_tidy(expr) # Error: object 'y' not found
Vincent D. Warmerdam - [@fishnets88] - GoDataDriven - koaning.io 23 Capture that AST Example of this delayed evaluation.
> expr <- quo(x + y) > rlang::eval_tidy(expr) # Error: object 'x' not found > x <- 1 > rlang::eval_tidy(expr) # Error: object 'y' not found > y <- 2 > rlang::eval_tidy(expr) [1] 3
Vincent D. Warmerdam - [@fishnets88] - GoDataDriven - koaning.io 24 Example of this trick.
show_size <- function(dataf, ...){ exprs <- quos(...) dataf %>% group_by(!!!exprs) %>% summarise(n = n()) } df %>% show_size(race) df %>% show_size(char) df %>% show_size(char, race)
Vincent D. Warmerdam - [@fishnets88] - GoDataDriven - koaning.io 25 Modern R code: dplyr
ddf %>% group_by(charclass, race) %>% summarise(n = n_distinct(char), mean_lvl = mean(level)) %>% arrange(-n)
The internals are interesting, but let's get back to analysis.
charclass race n mean_lvl <chr> <chr> <dbl> <dbl> 1 Warrior Orc 3506 62.42852 2 Paladin Blood Elf 3199 59.67628 ...
Vincent D. Warmerdam - [@fishnets88] - GoDataDriven - koaning.io 26 Let's write something useful! We have a cool tool/language. Let's do some cool analytics. — are people playing more in weekends? — how long does it take to get to level 60? — what things can we do to level up quicker? For the next part I will discuss some analysis patterns using dplyr and what you need to do if the dataset becomes very large.
Vincent D. Warmerdam - [@fishnets88] - GoDataDriven - koaning.io 27 Results First make a query per date (good for plotting).
df <- df_all %>% group_by(date = date(timestamp)) %>% summarise(n = n_distinct(char))
Next let's look at the code that makes a plot.
ggplot() + geom_line(data=df, aes(date, n), alpha=0.5)
Vincent D. Warmerdam - [@fishnets88] - GoDataDriven - koaning.io 28 Results The chart is nice but it can be much be!er.
ggplot() + geom_line(data=df, aes(date, n), alpha=0.7) + geom_point(data=df %>% grab_only("Sat"), aes(date, n), colour="steelblue", size=0.7) + geom_point(data=df %>% grab_only("Wed"), aes(date, n), colour="red4", size=0.7) + ggtitle("WoW Characters Online over Time", subtitle = "Note the weekly patten.") + ylim(0, NA)
Vincent D. Warmerdam - [@fishnets88] - GoDataDriven - koaning.io 30 Downside of Dataset Running this query took a fair amount of time, even though the dataset is only 600Mb. I want my investigation to be a bit more real-time if possible. So let's see if I can rewrite this in spark.
Vincent D. Warmerdam - [@fishnets88] - GoDataDriven - koaning.io 32 Downside of Dataset Running this query took a fair amount of time, even though the dataset is only 600Mb. I want my investigation to be a bit more real-time if possible. So let's see if I can rewrite this in spark. "BUT WAIT!" I hear you say. That might mean that you'd need to rewrite all your code! We've seen that pandas code and pyspark code is very different!
Vincent D. Warmerdam - [@fishnets88] - GoDataDriven - koaning.io 33 Downside of Dataset Running this query took a fair amount of time, even though the dataset is only 600Mb. I want my investigation to be a bit more real-time if possible. So let's see if I can rewrite this in spark. "BUT WAIT!" I hear you say. That might mean that you'd need to rewrite all your code! We've seen that pandas code and pyspark code is very different! This statement is true but luckily for us, R solves all that for us. We'll see that in our next example.
Vincent D. Warmerdam - [@fishnets88] - GoDataDriven - koaning.io 34 Next Task: Sessionising In this next portion we'll try to calculate the total amount of time it might take to reach level 60. Before we can do that, we need to sessionize the dataset. We'll implement all of this in sparklyr but let's first talk about what needs to happen.
Vincent D. Warmerdam - [@fishnets88] - GoDataDriven - koaning.io 35 Next Task: Sessionising
char level race charclass zone guild date ts 1 9 70 Orc Hunter The Barrens 79 2008-01-01 2008-01-01 12:02:20 2 9 70 Orc Hunter The Barrens 79 2008-01-01 2008-01-01 12:12:07 3 9 70 Orc Hunter The Barrens 79 2008-01-01 2008-01-01 12:22:40 4 9 70 Orc Hunter The Barrens 79 2008-01-01 2008-01-01 12:32:29 5 9 70 Orc Hunter The Barrens 79 2008-01-01 2008-01-01 12:42:18 6 9 70 Orc Hunter The Barrens 79 2008-01-01 2008-01-01 12:52:47 7 9 70 Orc Hunter Ashenvale 79 2008-01-01 2008-01-01 13:02:29 8 9 70 Orc Hunter Ashenvale 79 2008-01-01 2008-01-01 13:12:18 9 9 70 Orc Hunter Blackfathom Deeps 79 2008-01-01 2008-01-01 13:22:44 10 9 70 Orc Hunter Blackfathom Deeps 79 2008-01-01 2008-01-01 13:32:32 11 9 70 Orc Hunter Blackfathom Deeps 79 2008-01-01 2008-01-01 16:02:31 12 9 70 Orc Hunter Blackfathom Deeps 79 2008-01-01 2008-01-01 16:12:18 13 9 70 Orc Hunter Blackfathom Deeps 79 2008-01-01 2008-01-01 16:22:44 14 9 70 Orc Hunter Blackfathom Deeps 79 2008-01-01 2008-01-01 16:32:32 15 9 70 Orc Hunter Blackfathom Deeps 79 2008-01-01 2008-01-01 16:42:20 16 9 70 Orc Hunter Blackfathom Deeps 79 2008-01-01 2008-01-01 16:52:08 17 9 70 Orc Hunter Shattrath City 79 2008-01-01 2008-01-01 17:02:43
Vincent D. Warmerdam - [@fishnets88] - GoDataDriven - koaning.io 36 Next Task: Sessionising
date ts diff_mins new_session session_id 1 2008-01-01 2008-01-01 12:02:20 NA TRUE 1 2 2008-01-01 2008-01-01 12:12:07 10 FALSE 1 3 2008-01-01 2008-01-01 12:22:40 10 FALSE 1 4 2008-01-01 2008-01-01 12:32:29 10 FALSE 1 5 2008-01-01 2008-01-01 12:42:18 10 FALSE 1 6 2008-01-01 2008-01-01 12:52:47 10 FALSE 1 7 2008-01-01 2008-01-01 13:02:29 10 FALSE 1 8 2008-01-01 2008-01-01 13:12:18 10 FALSE 1 9 2008-01-01 2008-01-01 13:22:44 10 FALSE 1 10 2008-01-01 2008-01-01 13:32:32 10 FALSE 1 11 2008-01-01 2008-01-01 16:02:31 10 FALSE 1 12 2008-01-01 2008-01-01 16:12:18 120 TRUE 2 13 2008-01-01 2008-01-01 16:22:44 10 FALSE 2 14 2008-01-01 2008-01-01 16:32:32 10 FALSE 2 15 2008-01-01 2008-01-01 16:42:20 10 FALSE 2 16 2008-01-01 2008-01-01 16:52:08 10 FALSE 2 17 2008-01-01 2008-01-01 17:02:43 10 FALSE 2
Vincent D. Warmerdam - [@fishnets88] - GoDataDriven - koaning.io 37 Simple Dplyr Statement In this query wowdf is a local dataframe and it would do the trick we want.
wowdf %>% arrange(char, timestamp) %>% group_by(char) %>% mutate(unix_ts = as.integer(timestamp), unix_diff = unix_ts - lag(unix_ts)) %>% mutate(new_sess = ifelse(is.na(unix_diff), TRUE, unix_diff > 1000))
Let's now rewrite this into a spark query...
Vincent D. Warmerdam - [@fishnets88] - GoDataDriven - koaning.io 38 Simple Dplyr Statement In this query wowdf is not a local dataframe, it is a connection to a datasource, which could be ... anything SQL really ...
q <- wowddf %>% arrange(char, timestamp) %>% group_by(char) %>% mutate(unix_ts = unix_timestamp(timestamp), unix_diff = unix_ts - lag(unix_ts)) %>% mutate(new_sess = ifelse(is.na(unix_diff), TRUE, unix_diff > 1000)) explain(q)
Vincent D. Warmerdam - [@fishnets88] - GoDataDriven - koaning.io 39 Translation towards SparkSql
SELECT `char`, `level`, `race`, `charclass`, `zone`, `guild`, `timestamp`, `unix_ts`, `unix_diff`, CASE WHEN (((`unix_diff`) IS NULL)) THEN (TRUE) ELSE (`unix_diff` > 1000.0) END AS `new_sess` FROM ( SELECT `char`, `level`, `race`, `charclass`, `zone`, `guild`, `timestamp`, `unix_ts`, `unix_ts` - LAG(`unix_ts`, 1, NULL) OVER (PARTITION BY `char` ORDER BY `char`, `timestamp`) AS `unix_diff` FROM ( SELECT `char`, `level`, `race`, `charclass`, `zone`, `guild`, `timestamp`, UNIX_TIMESTAMP(`timestamp`) AS `unix_ts` FROM ( SELECT * FROM `df` ORDER BY `char`, `timestamp`) `rkdvulqmdg`) `efzujnwfsu`) `dbcscslutz`
Vincent D. Warmerdam - [@fishnets88] - GoDataDriven - koaning.io 40 Translation towards BigQuery
SELECT [char],[level],[race],[charclass], [zone],[guild],[timestamp],[unix_ts],[unix_diff], IF((([unix_diff]) IS NULL), TRUE, [unix_diff] > 1000.0) AS [new_sess] FROM ( SELECT [char],[level],[race],[charclass], [zone],[guild],[timestamp],[unix_ts], [unix_ts] - LAG([unix_ts], 1, NULL) OVER (PARTITION BY [char] ORDER BY [char], [timestamp]) AS [unix_diff] FROM ( SELECT [char],[level],[race],[charclass], [zone],[guild],[timestamp], UNIX_TIMESTAMP([timestamp]) AS [unix_ts] FROM ( SELECT * FROM [wow.cleansess] ORDER BY [char], [timestamp])))
Vincent D. Warmerdam - [@fishnets88] - GoDataDriven - koaning.io 41 Dat AST
Wondering how this works? Remember that trick with capturing an expression and being able to delay the evaluation? You can also take the expression and translate it. This is what is happening internally. There's a bit of magic here and there in the tidyverse but internally this is something that plays a very large part.
Vincent D. Warmerdam - [@fishnets88] - GoDataDriven - koaning.io 42 Independant Backend
Part of the design of tidyverse is to allow for a different
that you as a developer can be very expressive without needing to worry about performance. Currently, these backends are supported: data.frame, tibble, SQLite, PostgreSQL, Redshi!
Vincent D. Warmerdam - [@fishnets88] - GoDataDriven - koaning.io 43 Independant Backend
Part of the design of dplyr is to allow for a different
that you as a developer can be very expressive without needing to worry about performance. Currently, these backends are supported: data.frame, tibble, SQLite, PostgreSQL, Redshi!, MySQL, MariaDB, MonetDB, Presto, Spark
Vincent D. Warmerdam - [@fishnets88] - GoDataDriven - koaning.io 44 Independant Backend
Part of the design of dplyr is to allow for a different
that you as a developer can be very expressive without needing to worry about performance. Currently, these backends are supported: data.frame, tibble, SQLite, PostgreSQL, Redshi!, MySQL, MariaDB, MonetDB, Presto, Spark, Hive, Impala, Vertica, Teradata, Google BigQuery
Vincent D. Warmerdam - [@fishnets88] - GoDataDriven - koaning.io 45 Few Downsides
There are lots of SQL dialects and it is impossible to fully support all of them via the dplyr spec. Silly Example Not every engine handles things the same way. Spark will apply a window.lag() to any datatype while BigQuery will not allow for anything besides INT64 to be passed to the LAG() function.
Vincent D. Warmerdam - [@fishnets88] - GoDataDriven - koaning.io 46 Few Upsides
The functions that are passed will not be handled by R at all. This can be used as an advantage: R will do the SQL translation even when the function does not exist locally. Let's consider an example.
Vincent D. Warmerdam - [@fishnets88] - GoDataDriven - koaning.io 47 Spark/Hive Tricks
Can anybody see a function in this SQL query that does not belong to the tidyverse?
ddf %>% filter(level <= 60) %>% arrange(char, timestamp) %>% group_by(char) %>% mutate(unix_ts = unix_timestamp(timestamp), unix_diff = unix_ts - lag(unix_ts))
Vincent D. Warmerdam - [@fishnets88] - GoDataDriven - koaning.io 48 Spark/Hive Tricks
Can anybody see a function in this SQL query that does not belong to the tidyverse?
ddf %>% filter(level <= 60) %>% arrange(char, timestamp) %>% group_by(char) %>% mutate(unix_ts = unix_timestamp(timestamp), unix_diff = unix_ts - lag(unix_ts))
Even though unix_timestamp does not exist, no error!
Vincent D. Warmerdam - [@fishnets88] - GoDataDriven - koaning.io 49 Spark/Hive Tricks
Translation to Spark example.
ddf %>% filter(level <= 60) %>% arrange(char, timestamp) %>% group_by(char) %>% mutate(unix_ts = megatondinosaurhead(timestamp), unix_diff = unix_ts - lag(unix_ts))
This will translate to ...
Vincent D. Warmerdam - [@fishnets88] - GoDataDriven - koaning.io 50 SELECT `char`, `level`, `race`, `charclass`, `zone`, `guild`, `timestamp`, `unix_ts`, `unix_diff`, CASE WHEN (((`unix_diff`) IS NULL)) THEN (TRUE) ELSE (`unix_diff` > 1000.0) END AS `new_sess` FROM ( SELECT `char`, `level`, `race`, `charclass`, `zone`, `guild`, `timestamp`, `unix_ts`, `unix_ts` - LAG(`unix_ts`, 1, NULL) OVER (PARTITION BY `char` ORDER BY `char`, `timestamp`) AS `unix_diff` FROM ( SELECT `char`, `level`, `race`, `charclass`, `zone`, `guild`, `timestamp`, MEGATONDINOSAURHEAD(`timestamp`) AS `unix_ts` FROM ( SELECT * FROM `df` ORDER BY `char`, `timestamp`) `rkdvulqmdg`) `efzujnwfsu`) `dbcscslutz`
Vincent D. Warmerdam - [@fishnets88] - GoDataDriven - koaning.io 51 Sparklyr Functions
Why is this awesome? All HIVE functions should be available to you if they are available from SparkSQL. You can see these functions defined here. R will try help you from rewriting dplyr code. If you use as.character(colname) in dplyr it will get translated to CAST(colname AS STRING) implicitly in the SQL. Anything not recognizes will be translated like before.
Vincent D. Warmerdam - [@fishnets88] - GoDataDriven - koaning.io 52 All Session Code
agg_ddf <- ddf %>% filter(level <= 60) %>% arrange(char, timestamp) %>% group_by(char) %>% mutate(unix_ts = unix_timestamp(timestamp), unix_diff = unix_ts - lag(unix_ts)) %>% filter(unix_ts < 1220227200) %>% mutate(new_sess = ifelse(is.na(unix_diff), TRUE, unix_diff > 1000), session = new_sess %>% as.numeric() %>% cumsum()) %>% ungroup() %>% group_by(char, session, level, race, charclass, guild) %>% summarise(min_ts = min(unix_ts), max_ts = max(unix_ts)) %>% mutate(session_time = max_ts - min_ts) %>% ungroup() %>% group_by(char, level, race, charclass, guild = (guild != -1)) %>% summarise(level_time = sum(session_time)/60/60) %>% ungroup()
Vincent D. Warmerdam - [@fishnets88] - GoDataDriven - koaning.io 53 Apply Session Part
agg_ddf <- ddf %>% filter(level <= 60) %>% arrange(char, timestamp) %>% group_by(char) %>% mutate(unix_ts = unix_timestamp(timestamp), unix_diff = unix_ts - lag(unix_ts)) %>% filter(unix_ts < 1220227200) %>% mutate(new_sess = ifelse(is.na(unix_diff), TRUE, unix_diff > 1000), session = new_sess %>% as.numeric() %>% cumsum()) %>% ungroup() %>% group_by(char, session, level, race, charclass, guild) %>% summarise(min_ts = min(unix_ts), max_ts = max(unix_ts)) %>% mutate(session_time = max_ts - min_ts) %>% ungroup() %>% group_by(char, level, race, charclass, guild = (guild != -1)) %>% summarise(level_time = sum(session_time)/60/60) %>% ungroup()
Vincent D. Warmerdam - [@fishnets88] - GoDataDriven - koaning.io 54 Apply Statistic Part
agg_ddf <- ddf %>% filter(level <= 60) %>% arrange(char, timestamp) %>% group_by(char) %>% mutate(unix_ts = unix_timestamp(timestamp), unix_diff = unix_ts - lag(unix_ts)) %>% filter(unix_ts < 1220227200) %>% mutate(new_sess = ifelse(is.na(unix_diff), TRUE, unix_diff > 1000), session = new_sess %>% as.numeric() %>% cumsum()) %>% ungroup() %>% group_by(char, session, level, race, charclass, guild) %>% summarise(min_ts = min(unix_ts), max_ts = max(unix_ts)) %>% mutate(session_time = max_ts - min_ts) %>% ungroup() %>% group_by(char, level, race, charclass, guild = (guild != -1)) %>% summarise(level_time = sum(session_time)/60/60) %>% ungroup()
Vincent D. Warmerdam - [@fishnets88] - GoDataDriven - koaning.io 55 Result!
Vincent D. Warmerdam - [@fishnets88] - GoDataDriven - koaning.io 56 Result!
This etl code in R is: — readable from left to right, top to bottom — describable via do this then that — executable on many backends — optimizable internally (AST!) Being able to create a DSL in a language is a cool thing.
Vincent D. Warmerdam - [@fishnets88] - GoDataDriven - koaning.io 57 Running Sparklyr Locally
You can read .csv or .parquet locally. Even start the 'cluster'.
sc <- spark_connect("local", version = "2.2.0") ddf <- spark_read_csv(sc, 'df', 'wowclean.csv', col_types = cols( char = col_integer(), level = col_integer(), charclass = col_character(), zone = col_character(), guild = col_integer(), timestamp = col_datetime()))
Vincent D. Warmerdam - [@fishnets88] - GoDataDriven - koaning.io 58 What About ML?
The next few slides explain how you can model the time it takes to level in H20. I'll skip it in the interest of time since it is mostly syntax anyway, feel free to remember that H20 is a great tool.
Vincent D. Warmerdam - [@fishnets88] - GoDataDriven - koaning.io 59 What About ML?
R has your back as far as spark is concerned. There are two options; running it from Spark or with H2o on top of
sparklyr but I prefer to use the H2o varient.
partitions <- agg_ddf %>% filter(level != 60) %>% sdf_partition(training = 0.5, test = 0.5, seed = 42) train_frame <- as_h2o_frame(sc, partitions$training) test_frame <- as_h2o_frame(sc, partitions$test) hyper_parameters <- list(alpha = seq(0, 1, 0.1)) model_glm_grid <- h2o.grid( algorithm = "glm", grid_id = "glm_grid", hyper_params = hyper_parameters, training_frame = train_frame, validation_frame = test_frame, x = c('race', 'charclass', 'guild', 'level'), y = c('level_time') )
Vincent D. Warmerdam - [@fishnets88] - GoDataDriven - koaning.io 61 Observations — The code we just describe really works and it is rather clear. — That gridsearch feature is pretty sweet, much better than Spark's It is a library though, not a grammar and still has limits. We'll get back to this point in a moment. Before we do that, we should appreciate what we have by running this. The UI is pretty sweet.
Vincent D. Warmerdam - [@fishnets88] - GoDataDriven - koaning.io 62 Recap.
We've seen that modern R packages prefer grammars and how this offer flexibility. It makes it easy to learn, is very expressive and being independant of backend is great. I hope it's clear that currently, R actually has some nice features that are language-specific and also task specific (data/analytics). If you don't like R, you can run non-R code from R.
Vincent D. Warmerdam - [@fishnets88] - GoDataDriven - koaning.io 65 Recap.
But I've only been talking about somewhat current R
at this stage. I've only told you what is exiting about R today and have yet to show some ideas that are novel.
Vincent D. Warmerdam - [@fishnets88] - GoDataDriven - koaning.io 66 Recap.
But I've only been talking about somewhat current R
at this stage. I've only told you what is exiting about R today and have yet to show some ideas that are novel. To show why R still has features for the future, let's discuss that our common method of modelling ... is ... after some thinking ... really horrible. The problem with the model is rather general and it explain better with a simpler dataset.
Vincent D. Warmerdam - [@fishnets88] - GoDataDriven - koaning.io 67 General Modelling: the Problem
Suppose that I have a dataset with chickens.
weight Time Chick Diet 1 42 0 1 1 2 51 2 1 1 3 59 4 1 1 ... 576 234 18 50 4 577 264 20 50 4 578 264 21 50 4
Vincent D. Warmerdam - [@fishnets88] - GoDataDriven - koaning.io 68 ChickWeight: the dataset
Vincent D. Warmerdam - [@fishnets88] - GoDataDriven - koaning.io 69 Model 1: Base Regression
We could model it with a linear regression.
> model <- lm(weight ~ Time + Diet, data=chickweight) > model %>% summary() Estimate Std. Error t value Pr(>|t|) (Intercept) 10.9244 3.3607 3.251 0.00122 ** Time 8.7505 0.2218 39.451 < 2e-16 *** Diet2 16.1661 4.0858 3.957 8.56e-05 *** Diet3 36.4994 4.0858 8.933 < 2e-16 *** Diet4 30.2335 4.1075 7.361 6.39e-13 ***
No matter what backend you use, the model is all wrong.
Vincent D. Warmerdam - [@fishnets88] - GoDataDriven - koaning.io 70 Model 2: R-trick: Nested Regression
> chickweight %>% group_by(Diet) %>% nest() %>% mutate(mod = data %>% map(~ lm(weight ~ Time, data=.))) Diet data mod <fctr> <list> <list> 1 1 <tibble [220 x 3]> <S3: lm> 2 2 <tibble [120 x 3]> <S3: lm> 3 3 <tibble [120 x 3]> <S3: lm> 4 4 <tibble [118 x 3]> <S3: lm>
Better, but this is still wrong.
Vincent D. Warmerdam - [@fishnets88] - GoDataDriven - koaning.io 71 The problem
In Machine Learning if feels like we can pour data into a predefined model but it doesn't feel like we can define the model much. We're usually constrained to perhaps feature engineering and hyperparam tuning (which granted, is good enough for lots of problems).
Vincent D. Warmerdam - [@fishnets88] - GoDataDriven - koaning.io 72 The problem
In Machine Learning if feels like we can pour data into a predefined model but it doesn't feel like we can define the model much. We're usually constrained to perhaps feature engineering and hyperparam tuning (which granted, is good enough for lots of problems). Popular ML libraries don't offer a real DSL for models.
Vincent D. Warmerdam - [@fishnets88] - GoDataDriven - koaning.io 73 Model 3: Domain Model
I wrote what I want on a piece of paper: I want to basically try this, in a few lines of code.
Vincent D. Warmerdam - [@fishnets88] - GoDataDriven - koaning.io 74 'Your cat is broken.'
— Rlang Model Purist
Vincent D. Warmerdam - [@fishnets88] - GoDataDriven - koaning.io 75 Model 3: Domain Model rethinking
mod <- map2stan( alist( weight ~ dnorm(mu, sigma), mu <- intercept + slope[Diet]*Time, slope[Diet] ~ dnorm(0, 2), intercept ~ dnorm(0, 2), sigma ~ dunif(0, 10) ), data = ml_df, warmup = 500)
Vincent D. Warmerdam - [@fishnets88] - GoDataDriven - koaning.io 76 Model 3: Domain Model rethinking
Vincent D. Warmerdam - [@fishnets88] - GoDataDriven - koaning.io 77 Model 3: Domain Model rethinking
Vincent D. Warmerdam - [@fishnets88] - GoDataDriven - koaning.io 78 Model 3: Domain Model rethinking
mod <- map2stan( alist( weight ~ dnorm(mu, sigma), mu <- beta_0 + beta_1[Diet]*Time, beta_0 ~ dnorm(0, 2), beta_1[Diet] ~ dnorm(0, 2), sigma <- alpha_0 + alpha_1[Diet]*Time, alpha_0 ~ dunif(0, 10), alpha_1[Diet] ~ dunif(0, 10) ), data = ml_df, warmup = 500)
Vincent D. Warmerdam - [@fishnets88] - GoDataDriven - koaning.io 79 Model 3: Domain Model rethinking
Vincent D. Warmerdam - [@fishnets88] - GoDataDriven - koaning.io 80 Freedom
Vincent D. Warmerdam - [@fishnets88] - GoDataDriven - koaning.io 81 MetaModels!
Most cool things we saw today are all a result of the nonstandard evaluation that occurs in R. It is exactly this what makes ggplot2, dplyr, dbplyr, sparklyr and bigrquery
A logical next step in the ecosystem might be a convenient language of models. It can be designed to be independant of backend and it would be a huge feature for both industry and applied academia.
Vincent D. Warmerdam - [@fishnets88] - GoDataDriven - koaning.io 82 Make a DSL for Models
This is merely a proposal of what it might look like.
ml_df %>% modmaker({ p(Y_t | S_{t-1}) ~ N(mu[S{t-1}], sigma) p(S_{t} | S_{t-1}) ~ Categorical(p[S-{t-1}]) mu ~ N(0, 1) p ~ UniformDiscrete() }) %>% infer(backend='tensorflow', method='MCMC')
Vincent D. Warmerdam - [@fishnets88] - GoDataDriven - koaning.io 83 Make a DSL for Models
This is merely a proposal of what it might look like.
ml_df %>% modmaker({ p(Y_t | S_{t-1}) ~ N(mu[S{t-1}], sigma) p(S_{t} | S_{t-1}) ~ Categorical(p[S-{t-1}]) mu ~ N(0, 1) p ~ UniformDiscrete() }) %>% infer(backend='pytorch', method='adam')
Vincent D. Warmerdam - [@fishnets88] - GoDataDriven - koaning.io 84 Make a DSL for Models
This is merely a proposal of what it might look like.
ml_df %>% modmaker({ p(Y_t | S_{t-1}) ~ N(mu[S{t-1}], sigma) p(S_{t} | S_{t-1}) ~ Categorical(p[S-{t-1}]) mu ~ N(0, 1) p ~ UniformDiscrete() }) %>% infer(backend='H20::Linear')
Vincent D. Warmerdam - [@fishnets88] - GoDataDriven - koaning.io 85 The Future still needs to be Made
Designing a DSL is hard though. Can you come up with verbs such that you can simply declare the following models: — latent dirichlet allocation — trueskill — hidden markov models — domain recommenders
Vincent D. Warmerdam - [@fishnets88] - GoDataDriven - koaning.io 86 The Future still needs to be Made
Designing a DSL is hard though. Can you come up with verbs such that you can simply declare the following models: — latent dirichlet allocation — trueskill — hidden markov models — domain recommenders — your own creativity
Vincent D. Warmerdam - [@fishnets88] - GoDataDriven - koaning.io 87 The Future still needs to be Made
Once the UI is dreamt up things get exiting. We're getting near a standard format for exchanging dataframes via apache arrow. We're getting near a standard for numerics too: tensors. I hope it is clear that R won't need to care about backend too much. The grammar for models may become a thing. I wouldn't be suprised if the 1st usable version of it is written in R.
Vincent D. Warmerdam - [@fishnets88] - GoDataDriven - koaning.io 88 The Future still needs to be Made
It is good to note that there's plenty of bad things about R and. Silent errors might've been helping statisticians in the 90'ies but they're breaking docker containers today. Stuff like logging and stuff like;
c(1,2,3,4) + 1 c(1,2,3,4) + c(1,2,3)
Try it, you'll get dissapointed.
Vincent D. Warmerdam - [@fishnets88] - GoDataDriven - koaning.io 89 The Future still needs to be Made
I'm a fan of R, it made me a better professional and a happier human. Having said all this there's parts I don't like and
and parts of javascript (d3) too. It sometimes feels a bit strange to have to defend R to Python people though, it's all cats and dogs really.
Vincent D. Warmerdam - [@fishnets88] - GoDataDriven - koaning.io 90 Announcements!
Vincent D. Warmerdam - [@fishnets88] - GoDataDriven - koaning.io 92 Announcement
Vincent D. Warmerdam - [@fishnets88] - GoDataDriven - koaning.io 93 Let's get people working together to make the future more better. Questions?
Vincent D. Warmerdam - [@fishnets88] - GoDataDriven - koaning.io 94