
SLIDE 1
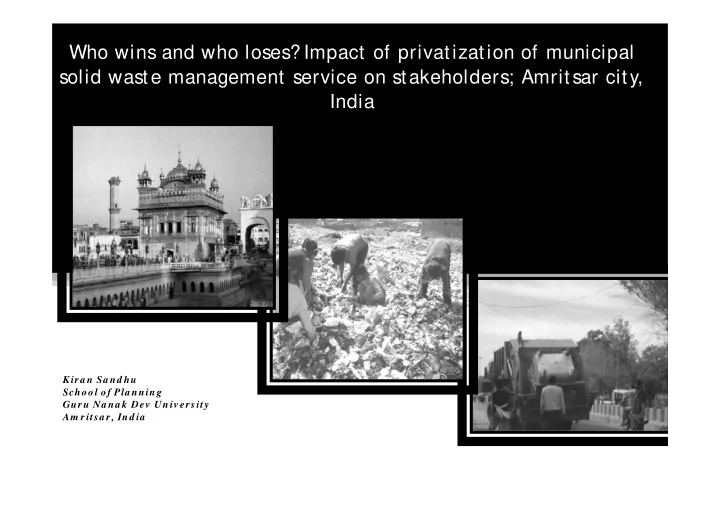
Who wins and who loses? Impact of privatization of municipal solid waste management service on stakeholders; Amritsar city, India
K ira n Sa nd hu School of Pla nning Guru Na na k Dev Univ ersity Am ritsa r, Ind ia
Who wins and who loses? Impact of privatization of municipal solid - - PowerPoint PPT Presentation
Who wins and who loses? Impact of privatization of municipal solid waste management service on stakeholders; Amritsar city, India K ira n Sa nd hu School of Pla nning Guru Na na k Dev Univ ersity Am ritsa r, Ind ia Backdrop As the
K ira n Sa nd hu School of Pla nning Guru Na na k Dev Univ ersity Am ritsa r, Ind ia
As the w orld hurtles tow ard its urban future, the am ount of m unicipal solid w aste one of the m ost im portant by-products of an urban lifestyle, is grow ing even faster than the rate of urbanization” (World Bank, 2012, p.ix).
Global growth of MSW
(ISWA, 2012)
1 2 3 4 5 6 7 8 2009 2025
MSW(billion tons)
20 23 26 28 31 41 5 10 15 20 25 30 35 40 45 1971 1981 1991 2001 2011 2021
Urban Population(%)
Source: Kundu, 2011, Census of India, 2011
6 48 70 370 50 100 150 200 250 300 350 400 1947 1997 2010 2030
MSW (million tonnes)
Source: computed from CBCB, 2000, CPCB, 2005, GOI, 2010
7% 93%
MSW Management
recycled disposed
Technology Review, 2010
200 400 600 800 1000 1200 1400 1600 1997 2001 2011 2021 2031 2041 2047 Land space (sq km)
Source: Technology Review: 2010
Milestones
Economic liberalization Urban reforms - 74th constitutional amendment The Surat Plague J.L. Bajaj Committee Recommendations Burman Committee Report MSW Rules JNNU RM 28 private sector participation projects approved under PPP mode Year
1991 1992 1994 1995 1999 2000 2005 2009
PSP in MSW operations begin.. MSW management by municipalities
Privatization Rationale/ assum ption
economic efficiency, social sustainability and better environmental management.
Informal waste sector Municipal sanitation employees Private company sanitation employees Community
GOI, 2010, GOI, 2009, Post, Broekema& Obirih-Opareh, 2003 (Anderson, 2011, Hanrahan, Srivastva &Ramakrishna, 2006, Saxena, Srivastva &Sammadar, 2010)
mixed Lack of empirical evidence/ research into assessing the social implications However…
stakeholders Im pact Indicators Informal waste sector Loss of employment and income Public sector employees Employee retrenchment and change in working conditions Private sector employees Working conditions and adherence to labour laws Community Distributive equity
Social sustainability Indicators
(census 2011).
1,08 1,13 1,48 1,84 0,45 0,49 0,52 0,6 0,2 0,4 0,6 0,8 1 1,2 1,4 1,6 1,8 2 2001 2011 2021 2031
waste generation trends per capita
population (million) per capita waste generation(kgs)
200 400 600 800 1000 1200
2001 2011 2021 2031
489,11 631,22 786,29 1046,04
MSW tonnes/ day
57% 16% 9% 15% 5%
MSW com position
short-term biodegradables long term biodegradables/ combus tibles recyclables inert sanitary/ others
Households/ waste generators Secondary storage AMC Unsegregated disposal at landfill/ dumps Ragpickers Small/ large scrap dealers Recycling Units Improper disposal Municipal solid waste management prior to privatization
March 2006 AMC passes resolution for MSW management using PSP June 2008 Preparation of DPR using a Private Consultant July 2008 Publication of EOI Sept 2008 Bidding and award to M/ S Antony Waste Handling Cell Pvt Ltd (phase I) in PPP mode under JNNURM Oct 2008 Contract signing Feb 2009 MSW Operations begun August 2012 Withdrawal of operations by the private company Dec 2012 Unending quest by AMC for privatization… till date
Private company door to door Collection (HH) Households/ waste generators Secondary storage Collection &Transportation AMC Street sweeping
Unsegregated disposal at landfill/ dumps Walled city -all Operations Ragpickers Small/ large scrap dealers Recycling Units W T E Informal stakeholders Privatization operations (feb 2009)
W.Bengal, Bihar, Maharashtra Stay Duration 1-30 years HH size 6-7 persons Majority close to BPL line (33.30INR) 74 16 10 chronic rural poverty unskilled personal circumstances
Before Privatization After Privatization Door to door access to waste recyclables Waste pickers no longer had access to household waste, the primary source of recyclables resulting in loss of livelihoods Cordial territorial route demarcations Breach in territorial route demarcations resulting in competition, conflict and rupture in their social fabric enhancing inner tensions. Segregation and recovery of recyclables in better quality conditions Mixing and compaction of waste especially through compaction units of the private company rendered acute reduction of the quality of recyclables like plastic and paper leading to difficulties in segregation and further decline of incomes. Access to secondary waste containers Informal policing by private company staff to enhance waste quantity on which their profits depended (as the payment was tonnage based). More possibilities of climbing up the economic ladder No further possibility due to reduced access to waste coupled with larger competition amongst the waste pickers. Customary right to waste Right claimed by the private company till the disposal took place after weighing waste quantities at the landfill.
Waste picker categories Income before private operations began (average earnings/ month in Rupees) Income after private
(average earnings/ month in Rupees) Average decline (Rupees) Average decline in % Waste pickers (landfill) 5500 4000 1500 27 Waste pickers (roadside and secondary bins) 5000 3500 1500 30 Waste pickers (households) 6000 2000 4000 60 Itinerant waste buyers 10,000 9000 1000 10
Impact on Municipal sanitation workers S cale of social sustainability
Scale AMC sanitary workers Low (1) High retrenchment and layoffs Major adverse impact on income No absorption of contract municipal employees by private company. Adverse working conditions. Irrelevance of the sanitary union. Medium (2) Some retrenchment/ layoffs. Minor adverse impact on income Limited absorption of contract municipal employees by private company. Average working conditions. Limited role of the sanitary union. High (3) No retrenchment/ layoffs but follow the course of natural attrition. No adverse impact on income Absorption of a majority of contract municipal employees by private company. Optimal working conditions. Relevant role of the sanitary union.
Municipal Commissioner (1) Joint/Deputy Commissioner (1) Medical Officer of Health (1) Assistant Health Officer (1) Chief Sanitary Inspectors (3) Sanitary Inspectors (20) Sanitary Supervisors (40) Sanitary Workers(1360 Permanent, 1050 Contract based )
0,5 1 1,5 2 2,5 3 Employee layoff/ retrenchment Impact on employee income Absorption by private company Working conditions impact on sanitary union high medium low status
Scale Im pacts on private com pany em ployees Low (1) Poor employee wages and service benefits High labour turnover and downsizing Lack of provision of safety gear Adverse working conditions Unjustifiable termination procedures Medium (2) Low employee wages and service benefits Some labour turnover and downsizing Some provision of safety gear Impact on working conditions Some adherence to termination procedures High (3) Employee wages and service benefits as per labour laws Minimal labour turnover and downsizing Provision of safety gear Optimal working conditions Justifiable termination procedures
Manager (1) Deputy Manager (1) Sanitary Supervisors(4) Vehicle Drivers (88) Vehicle Repair Mechanics (5) Sanitary Workers (155)
0,5 1 1,5 2 2,5 3 Employee wages and service benefits labout turnover and downsizing Provision of safety gear impact on working conditions Justifiable termination procedures high medium low status
Incom e category No access to door to door service Placem ent of secondary containers inaccessible from hom es
High income 6.5% 35.5% Middle income 34.04% 32.6% Low income 43.75% 65.9% Economically weaker section 51.39% 81.3%
0,5 1 1,5 2 2,5 3 Informal waste sector municipal sanitation employees private sanitation employees community distributive equity low medium high scale of social sustainability
THANKS…. Final words..