WHAT YOU THOUGHT OF YOUR PRACTICE!! GP Penrhyn Surgery Patient - - PowerPoint PPT Presentation

what you thought of your practice
SMART_READER_LITE
LIVE PREVIEW

WHAT YOU THOUGHT OF YOUR PRACTICE!! GP Penrhyn Surgery Patient - - PowerPoint PPT Presentation

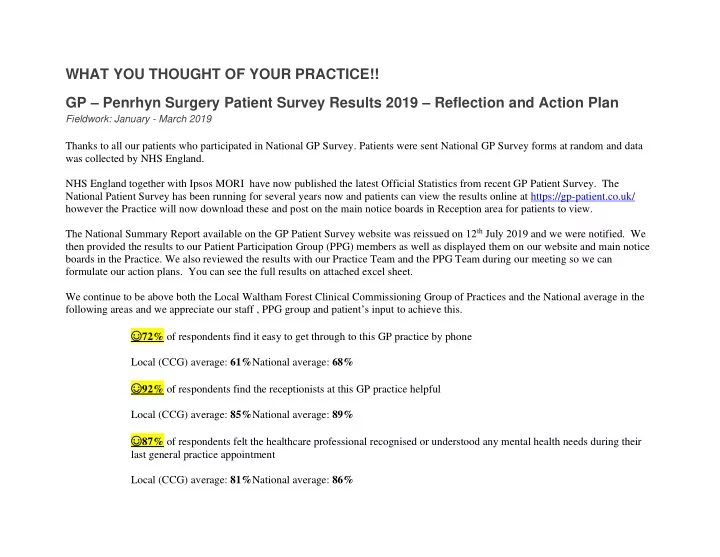
WHAT YOU THOUGHT OF YOUR PRACTICE!! GP Penrhyn Surgery Patient Survey Results 2019 Reflection and Action Plan Fieldwork: January - March 2019 Thanks to all our patients who participated in National GP Survey. Patients were sent National GP


slide-1
SLIDE 1

WHAT YOU THOUGHT OF YOUR PRACTICE!! GP – Penrhyn Surgery Patient Survey Results 2019 – Reflection and Action Plan

Fieldwork: January - March 2019

Thanks to all our patients who participated in National GP Survey. Patients were sent National GP Survey forms at random and data was collected by NHS England. NHS England together with Ipsos MORI have now published the latest Official Statistics from recent GP Patient Survey. The National Patient Survey has been running for several years now and patients can view the results online at https://gp-patient.co.uk/ however the Practice will now download these and post on the main notice boards in Reception area for patients to view. The National Summary Report available on the GP Patient Survey website was reissued on 12th July 2019 and we were notified. We then provided the results to our Patient Participation Group (PPG) members as well as displayed them on our website and main notice boards in the Practice. We also reviewed the results with our Practice Team and the PPG Team during our meeting so we can formulate our action plans. You can see the full results on attached excel sheet. We continue to be above both the Local Waltham Forest Clinical Commissioning Group of Practices and the National average in the following areas and we appreciate our staff , PPG group and patient’s input to achieve this. ☺72% of respondents find it easy to get through to this GP practice by phone Local (CCG) average: 61%National average: 68% ☺92% of respondents find the receptionists at this GP practice helpful Local (CCG) average: 85%National average: 89% ☺87% of respondents felt the healthcare professional recognised or understood any mental health needs during their last general practice appointment Local (CCG) average: 81%National average: 86%

slide-2
SLIDE 2

We noticed three main areas where we achieved lowest compared to the CCG average and we wish to work on supported by our Patient Participation Group Team.

∞29% of respondents usually get to see or speak to their preferred GP when they would like to Local (CCG) average: 44%National average: 48% ∞47% of respondents were offered a choice of appointment when they last tried to make a general practice appointment Local (CCG) average: 61% National average: 62% ∞60% of respondents were satisfied with the type of appointment they were offered Local (CCG) average: 69% National average: 74%

SURVEY 2019 ACTION PLAN SUMMARY SHEET

ACTION AREA TO LOOK AT i.e. Question or comments from the survey CURRENT SITUATION ACTION Responsible Person

29% of respondents usually get to see or speak to their preferred GP when they would like to

Only 12 patients i.e 29% could always or almost always or a lot of the time speak to preferred GP compared to CCG percentage

  • f 44%and nationally 48%

This question was not in 2018 survey to compare performance We looked at factors influencing patient

1.Clinic structure and design – Longer appointments and reserved slots to ensure continuity is prioritized where appropriate.

  • 2. Role of Receptionist/Care Navigator –

Receptionist to appropriately direct patients and manage clinicians appointments to support continuity Suzia (Double slots and dr reserved appointments now added to appointment system) Suzia (new banner on

slide-3
SLIDE 3

preferences for continuity

  • Prior relationship with own

GP/clinician

  • 3. Alternatives to face to face consultation

Increase in use of email and telephone consultations to support whole pathway of care and helping maintain the relationship between patient and clinician.

  • 4. Patient Awareness Staff to inform

patients whenever possible that electronic and shared records can allow clinician to have a better understanding of a patient who they have never met before website regarding e- consultation- reception staff advised regarding use of e-consultation especially for fit note requests ) 47% of respondents were

  • ffered a choice of

appointment when they last tried to make a general practice appointment Survey revealed total 79 responses received – out

  • f which 37 patients were
  • ffered choice of

appointment - 47% 37(Practice) 61% 1855 (CCG) 62% 365368 (National) PPG agreed to have more information for patients so they can understand what is available for them Over recent years practice has seen year on year increase in demand for appointment due to care moving out of hospitals, people living longer and more complex care for chronic conditions. Role of front staff and practice website to provide information to patients regarding choices available for them. Staff meeting informing and discussing the need to offer patients all available appointments so patient can choose best method of consultation for them. Reception Team (Some team members were not able to book directly into Fednet slots – now all staff are trained and advising patients of

  • ther options and

choices available to them) 60% of respondents were satisfied with the type of appointment they were offered Breakdown of type of consultations booked at practice

Practice 1 Practice 1 (N) CCG 1 CCG 1 National (%) National (N)

slide-4
SLIDE 4

(%) (%) (N) to speak to someone on the phone 6% 5 9% 305 9% 60756 to see someone at my GP practice 88% 69 86% 2824 86% 549943 to see someone at another general practice location 4% 3 4% 128 4% 24930 to speak to someone online, for example on a video call 0% 0% 1 0% 596 for a home visit 2% 2 1% 18 1% 4944 Total 78 3275 641168

Only 6% patients booked telephone appointments. 88% of patients called to book GP face to face consultation therefore the demand is for more GP face to face consultations rather than telephone appointments. A study published in peer reviewed medical journal, The Lancet has shown that instead of saving time, the phone service actually increased the

  • workload. https://www.nhs.uk/news/medical-practice/phone-consultations-

do-not-reduce-gp-workload/ Suzia to do draft appointment plan for GPs to review workload for GPs and patient benefits. Suzia to do research and present draft of “GP Appointment type survey” for new appointment system in meeting for approval (completed 18/12/19). Please see below

slide-5
SLIDE 5

CURRENT GP APPOINTMENTS/WEEK MONDAY TUESDAY WEDNESDAY THURSDAY FRIDAY AM t/calls PM AM t/calls PM AM t/calls PM AM t/calls PM AM t/calls PM KO 15 5 12 12 5 12 15 5 15 5 AN 12 5 12 12 5 12 15 5 12 5 12 LC 15 5 12 12 5 12 TO 15 5 15 5 12 27 10 24 27 10 24 27 10 12 45 15 39 15 36 321 appointments/week NEW APPOINTMENT SYSTEM - CHANGING TO MORE TELEPHONE ADVICE APPOINTMENTS MONDAY TUESDAY WEDNESDAY THURSDAY FRIDAY AM t/calls PM AM t/calls PM AM t/calls PM AM t/calls PM AM t/calls PM KO 36 12 36 12 36 36 AN 36 12 36 12 36 36 12 LC 36 12 36 12 TO 36 36 12 72 24 72 24 72 12 108 108 36 528 appointments/week There is increase of 207 appointments 64.49% per week