
Further Mathematics Past-student perspective
Hayley Short Recent VCE Graduate
What’s up?
- Reflect on today’s VCE Seminar…
– Think about what you want to achieve from today / Further / VCE / life in general – Take a moment to say hi!
Hayley Short
- Graduated in 2013
- Studying at Monash University
– Bachelor of Business (Accounting)
- Seminars Director with Engage
- Harry Potter Nerd…
Motivation
You’re almost there!
- Know what motivates you:
– Competition? – A specific end goal? – Constructive fear?
Study Techniques
How can I study effectively to score well on exams?
Engage Education Foundation
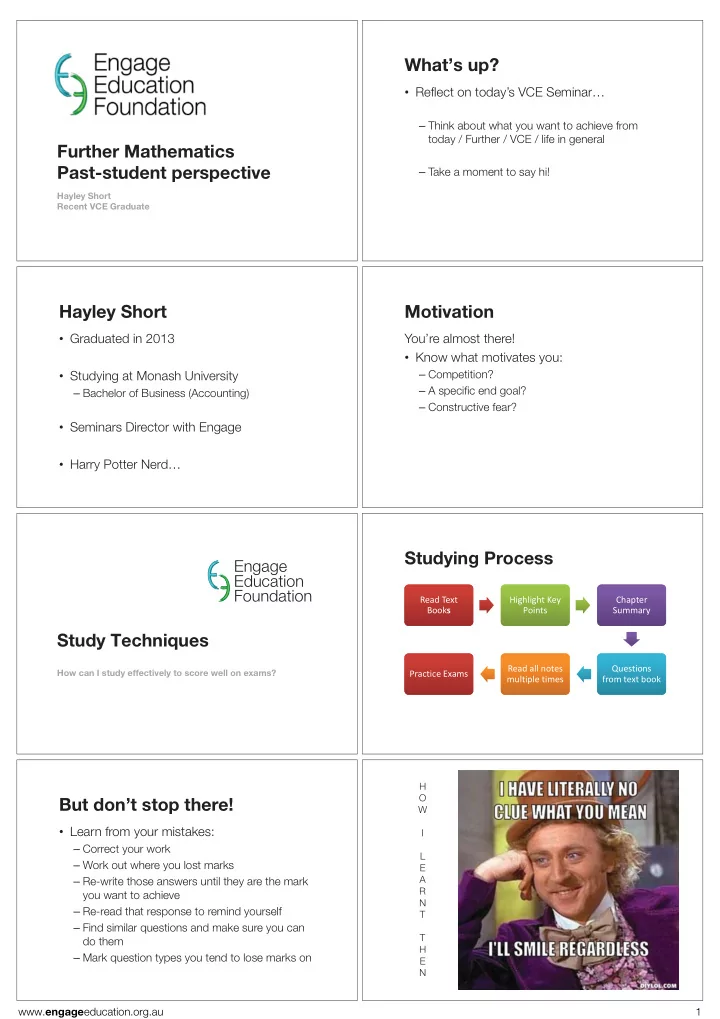
Studying Process
ReadText Books ReadText Books HighlightKey Points HighlightKey Points Chapter Summary Chapter Summary Questions fromtextbook Questions fromtextbook Readallnotes multipletimes Readallnotes multipletimes PracticeExams PracticeExams
But don’t stop there!
- Learn from your mistakes:
– Correct your work – Work out where you lost marks – Re-write those answers until they are the mark you want to achieve – Re-read that response to remind yourself – Find similar questions and make sure you can do them – Mark question types you tend to lose marks on
H O W I L E A R N T T H E N
www.engageeducation.org.au 1