What does TCSCF do? What does TCSCF do? Second First We provide - - PDF document

what does tcscf do what does tcscf do
SMART_READER_LITE
LIVE PREVIEW

What does TCSCF do? What does TCSCF do? Second First We provide - - PDF document

Tri-County Steer Carcass Lessons Learned From 34 Years of Futurity (TCSCF) Retained Ownership Tri-County Steer Carcass Futurity First year 35 consignors - 106 steers What is the most profitable steer in the Darrell Busby feedlot?


slide-1
SLIDE 1

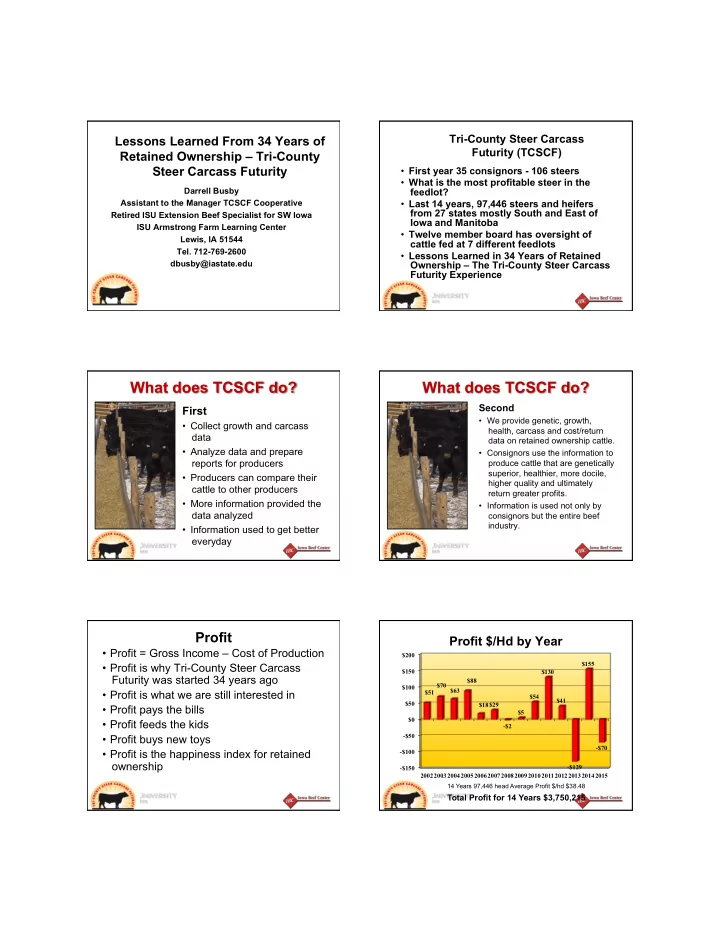
Lessons Learned From 34 Years of Retained Ownership – Tri-County Steer Carcass Futurity

Darrell Busby Assistant to the Manager TCSCF Cooperative Retired ISU Extension Beef Specialist for SW Iowa ISU Armstrong Farm Learning Center Lewis, IA 51544

  • Tel. 712-769-2600

dbusby@iastate.edu

Tri-County Steer Carcass Futurity (TCSCF)

  • First year 35 consignors - 106 steers
  • What is the most profitable steer in the

feedlot?

  • Last 14 years, 97,446 steers and heifers

from 27 states mostly South and East of Iowa and Manitoba

  • Twelve member board has oversight of

cattle fed at 7 different feedlots

  • Lessons Learned in 34 Years of Retained

Ownership – The Tri-County Steer Carcass Futurity Experience

What does TCSCF do?

First

  • Collect growth and carcass

data

  • Analyze data and prepare

reports for producers

  • Producers can compare their

cattle to other producers

  • More information provided the

data analyzed

  • Information used to get better

everyday

What does TCSCF do?

Second

  • We provide genetic, growth,

health, carcass and cost/return data on retained ownership cattle.

  • Consignors use the information to

produce cattle that are genetically superior, healthier, more docile, higher quality and ultimately return greater profits.

  • Information is used not only by

consignors but the entire beef industry.

Profit

  • Profit = Gross Income – Cost of Production
  • Profit is why Tri-County Steer Carcass

Futurity was started 34 years ago

  • Profit is what we are still interested in
  • Profit pays the bills
  • Profit feeds the kids
  • Profit buys new toys
  • Profit is the happiness index for retained
  • wnership

Profit $/Hd by Year

  • $150
  • $100
  • $50

$0 $50 $100 $150 $200 2002 2003 2004 2005 2006 2007 2008 2009 2010 2011 2012 2013 2014 2015 $51 $70 $63 $88 $18 $29

  • $2

$5 $54 $130 $41

  • $129

$155

  • $70

14 Years 97,446 head Average Profit $/hd $38.48

Total Profit for 14 Years $3,750,215

slide-2
SLIDE 2

Profit Groups by Year

Ranked and Divided into 6ths by Year

  • Consigned to the Iowa Tri-County Steer Carcass Futurity

(TCSCF) from 2002–13

  • 77,717 head of steers and heifers
  • Analysis provided by Certified Angus Beef
  • Only cattle with complete carcass data
  • Profit = gross income – home value – trucking to feedlot –

finishing costs

  • Profit does not include risk management income or

expense

  • 25 states and Manitoba represented

Profit Groups by Year

Ranked and Divided into 6ths by Year

  • For example, if there were had 6,000 hd in one year
  • They were sorted from most profitable to least profitable
  • The most profitable 1,000 head were averaged
  • The next most profitable 1,000 head were averaged
  • The next most profitable 1,000 head were averaged
  • The next most profitable 1,000 head were averaged
  • The next most profitable 1,000 head were averaged
  • The least profitable 1,000 head were averaged

Profit Groups by Year

Ranked and Divided into 6ths by Year

  • This method analysis removes year effect
  • Fluctuations in feeder calf, corn or feed and fed

cattle market

  • Each animal is ranked within the year it was

marketed

Profit $/Hd by Profit Group

  • $150.00
  • $100.00
  • $50.00

$0.00 $50.00 $100.00 $150.00 $200.00 $250.00 Least 5th 4th 3rd 2nd Most

  • $120.42
  • $23.59

$26.58 $71.92 $123.40 $216.63 Profit $/ Hd

a b c e d f abcdef Means with unlike superscripts differ, P<0.05

Overall effect P<0.0001

Profit $/Hd by Profit Group

  • $150.00
  • $100.00
  • $50.00

$0.00 $50.00 $100.00 $150.00 $200.00 $250.00 Least 5th 4th 3rd 2nd Most

  • $120.42
  • $23.59

$26.58 $71.92 $123.40 $216.63 Profit $/ Hd

a b c e d f abcdef Means with unlike superscripts differ, P<0.05

Overall effect P<0.0001

Profit $/Hd by Profit Group

  • $150.00
  • $100.00
  • $50.00

$0.00 $50.00 $100.00 $150.00 $200.00 $250.00 Least 5th 4th 3rd 2nd Most

  • $120.42
  • $23.59

$26.58 $71.92 $123.40 $216.63 Profit $/ Hd

a b c e d f abcdef Means with unlike superscripts differ, P<0.05

Overall effect P<0.0001

slide-3
SLIDE 3

Profit $/Hd by Profit Group

  • $150.00
  • $100.00
  • $50.00

$0.00 $50.00 $100.00 $150.00 $200.00 $250.00 Least 5th 4th 3rd 2nd Most

  • $120.42
  • $23.59

$26.58 $71.92 $123.40 $216.63 Profit $/ Hd

a b c e d f abcdef Means with unlike superscripts differ, P<0.05

Overall effect P<0.0001

Profit $/Hd by Profit Group

  • $150.00
  • $100.00
  • $50.00

$0.00 $50.00 $100.00 $150.00 $200.00 $250.00 Least 5th 4th 3rd 2nd Most

  • $120.42
  • $23.59

$26.58 $71.92 $123.40 $216.63 Profit $/ Hd

a b c e d f abcdef Means with unlike superscripts differ, P<0.05

Overall effect P<0.0001

Profit Difference $/Hd by Highest and Lowest Profit Group from 2003 to 2012

$200.00 $250.00 $300.00 $350.00 $400.00 $450.00 $500.00 2003 2004 2005 2006 2007 2008 2009 2010 2011 2012

$231.10 $343.19 $328.46 $351.36 $319.33 $283.73 $344.51 $331.62 $378.53 $460.64

Profit Difference

abcdef Means with unlike superscripts differ, P<0.05

Feedlot In Weight by Profit Group

600 610 620 630 640 650 660 670 680 690 700 Least 5th 4th 3rd 2nd Most 679 667 661 656 651 662 Feedlot In Wt

b a b c b d abcd Means with unlike superscripts differ, P<0.05

Overall effect P<0.0001

Feeder Market Value $/cwt by Profit Group

$75 $80 $85 $90 $95 $100 $105 $110 $115 $120 $125 Least 5th 4th 3rd 2nd Most $104.44 $101.05 $99.17 $97.42 $95.64 $91.47 Market Value $/cwt

a b c e d f abcdef Means with unlike superscripts differ, P<0.05

Overall effect P<0.0001

Feeder Market Value $/Hd by Profit Group

$550 $570 $590 $610 $630 $650 $670 $690 $710 $730 $750 Least 5th 4th 3rd 2nd Most $707.52 $671.61 $651.60 $634.25 $617.32 $596.87 Market Value $/hd

a b c e d f abcdef Means with unlike superscripts differ, P<0.05

Overall effect P<0.0001

slide-4
SLIDE 4

Feeder Market vs. Gross Value $/cwt by Profit Group

$75 $80 $85 $90 $95 $100 $105 $110 $115 $120 $125 Least 5th 4th 3rd 2nd Most $104.44 $101.05 $99.17 $97.42 $95.64 $91.47 $87.93 $98.32 $103.96 $108.88 $114.71 $124.14 Market Value $/cwt Gross Value $/cwt

a b c e d f abcdef Means with unlike superscripts differ, P<0.05

Overall effect P<0.0001

Final Weight by Profit Group

1,150 1,160 1,170 1,180 1,190 1,200 1,210 1,220 1,230 1,240 Least 5th 4th 3rd 2nd Most 1179 1185 1192 1199 1204 1231 Final Wt

a b c e d abcdef Means with unlike superscripts differ, P<0.05

Overall effect P<0.0001

f

Warm-up ADG by Profit Group

2.80 2.90 3.00 3.10 3.20 3.30 3.40 3.50 3.60 3.70 3.80 Least 5th 4th 3rd 2nd Most 3.13 3.38 3.47 3.52 3.60 3.72 ADG

a b c e d f abcdef Means with unlike superscripts differ, P<0.05

Overall effect P<0.0001

Overall ADG by Profit Group

2.80 2.90 3.00 3.10 3.20 3.30 3.40 3.50 Least 5th 4th 3rd 2nd Most 3.06 3.20 3.26 3.29 3.34 3.46 ADG

a b c e d f abcdef Means with unlike superscripts differ, P<0.05

Overall effect P<0.0001

Total Cost of Gain $/cwt by Profit Group

$65 $67 $69 $71 $73 $75 $77 $79 $81 $83 $85 Least 5th 4th 3rd 2nd Most $82.08 $76.60 $74.59 $73.34 $71.92 $69.79 Total Cost of Gain

a b c e d f abcdef Means with unlike superscripts differ, P<0.05

Overall effect P<0.0001

% Treated Once or 2 or More Times by Profit Group

2 4 6 8 10 12 14 16 18 20 Least 5th 4th 3rd 2nd Most 18.3 14.2 12.8 11.4 10.5 10.3 12.03 5.66 4.35 3.28 2.48 2.08 % Treated Once % Treated 2

  • r More

Times

a b c e d f abcdef Means with unlike superscripts differ, P<0.05

Overall effect P<0.0001

slide-5
SLIDE 5

Health Related Considerations

  • Medicine costs
  • Labor/chute charges
  • Mortality rate
  • Feedlot gain
  • Carcass merit

– Greater importance with transition toward value-based marketing

Delivery wt and age on morbidity

Number of treatments

No Treatments (NT) Single Treatment (ST) 2 Treatments

  • r more

(2T)

  • No. of cattle

39,188 5,570 2,286 % of Total 82% 12% 6% Delivery wt, lb 649a 616b 602c Age on delivery 303a 274b 264c

abcP<0.05

Effect of morbidity on feedlot gain and feed efficiency

Number of treatments (NT) (ST) (2T) Final wt, lb 1181a 1153b 1132c Days on feed 167a 178b 184c ADG, lb 3.21a 3.06b 2.93c

  • Est. F:G

6.89a 6.76b 6.66c

  • Est. DMI

22.1 20.7 19.5

abcP<0.05

Effect of morbidity on USDA yield grades and distribution

Number of treatments NT ST 2T Fat cover, inch

0.46a 0.44b 0.40c

Calculated, Yield Grade

2.86a 2.75b 2.63c Yield Grade 1& 2, % 57.64a 63.97b 71.93c Yield Grade 3, % 39.96a 34.36b 27.06c Yield Grade 4 &5, % 2.40a 1.67b 1.00c

abcP<0.05

Effect of morbidity on USDA quality grade* distribution

Number of treatments NT ST 2T Marbling score SM 29a SM 14b SL 96c Prime, % 1.02a 0.77b 0.65c Premium Choice, % 15.45a 11.64b 9.12c Low Choice, % 52.26a 47.53b 42.25c Select, % 29.13a 36.26b 39.59c Standard, % 2.13a 3.80b 8.38c % CAB 18.7a 14.4b 11.12c

*Premium and Low Choice determination based on marbling score.

P-value represents Mantel-Haenszal Chi-square.

Difference in dollars returned per head relative to the number of treatments (2004)

Number of treatments

NT ST 2T Death loss discount*, $ PAR –31.07 –100.04 Treatment cost**, $ PAR –20.60 –48.43 ADG reduction#, $ PAR –24.49 –35.71 Yield grade premium, $ PAR +2.90 +4.59 Quality grade discount, $ PAR –10.39 –19.41 Light carcass discount, $ PAR –1.55 –1.58 Dark cutter adjustment, $ PAR +0.18 –0.58 Total difference, $ PAR –85.02 –201.16

*Accounts for cost of gain investment and lost carcass value. **Includes medicine, labor and chute/equipment charges. #Based on additional carcass weight gained during the feeding period.

slide-6
SLIDE 6

Difference in dollars returned per head relative to the number of treatments(2014)

Number of treatments

NT ST 2T Death loss discount*, $ PAR –$54.91 –$216.85 Treatment cost**, $ PAR –$25.16 –$64.28 ADG Bonus#, $ PAR –$34.56 –$68.74 Yield grade premium, $ PAR +$1.62 +$4.03 Quality grade discount, $ PAR –$5.35 –$14.29 Light carcass discount, $ PAR –$1.61 –$4.69 Dark cutter adjustment, $ PAR +$0.05 –$0.19 Total difference, $ PAR –$119.92 –$365.01

*Accounts for cost of gain investment and lost carcass value. **Includes medicine, labor and chute/equipment charges. #Based on additional carcass weight gained during the feeding period.

Health Treatment Impact on Tenderness (Engelken, et al 2009)

Item Untreated One Treatment Two or more Treatments Number of calves 203 94 62 Overall ADG 3.32a 3.34a 3.08b Marbling Score SM 51a SM 16a SL 99b Premium Choice % 15.3% 7.6% 3.6% Choice - % 65.5% 56.5% 50.0% Select % 19.2% 35.9% 46.4% Warner-Bratzler Shear lb 6.01a 6.47b 6.47b Profit or (loss) $62.21a $58.96a ($38.24) b

a,b Numbers within same row without a common

superscript are significantly different (p< .05)

15 30 45 60 75 B R D M O R B I D I 15 30 45 60 75 % 1 S T T R E A T M E

30 6 38 28 6 57 13 1 31 NON-WEANED WEAN < 30 D WEAN >= 30 D % TREATED % TREATED > 3X % 1ST TREAT RELAPSE

The Effect of Weaning Status on BRD Morbidity and First Treatment Relapse The Effect of Pre-Trial Vaccine Type (Killed or MLV) on BRD Morbidity

10 20 30 40 50 60 B R D M O R B I D I 10 20 30 40 50 60 % 1 S T T R E A T M E

32 10 52 18 3 52

KILLED MLV

% TREATED % TREATED >= 3X % 1ST TREAT RELAPSE

What about sire differences?

Every breed has high and low profit sires in the TCSCF analysis!

2010 TCSCF Sire Profit Analysis

Comparison ¡of ¡Top ¡Profit ¡Bulls ¡to ¡Bo3om ¡Profit ¡Bulls: ¡2008 ¡-­‑ ¡2010 ¡

¡ ¡

Sire ¡Groupings ¡

¡ ¡Trait ¡ Top ¡25% ¡ Bo3om ¡ 25% ¡ All ¡Sire ¡ Average ¡ Number ¡of ¡Sires ¡===> ¡ 199 ¡ 202 ¡ 806 ¡ Feedlot ¡Performance ¡ ¡ ¡ ¡ ¡Delivery ¡Weight ¡ 691 ¡ 657 ¡ 676 ¡ ¡ ¡SPA ¡Calf ¡Value ¡ $520 ¡ $502 ¡ ¡ $512 ¡ ¡ ¡Ave. ¡DisposiGon ¡Score ¡ 1.84 ¡ 1.90 ¡ 1.90 ¡ ¡ ¡Overall ¡ADG ¡ 3.30 ¡ 3.06 ¡ 3.18 ¡ ¡ ¡Final ¡Weight ¡ 1214 ¡ 1152 ¡ 1185 ¡ ¡ ¡Feed ¡to ¡Gain ¡ 6.76 ¡ 6.93 ¡ 6.91 ¡ ¡ ¡Feed ¡Cost/cwt ¡of ¡Gain ¡ $50.73 ¡ $51.98 ¡ ¡ $51.79 ¡ ¡ Health ¡Performance ¡ ¡ ¡ ¡ ¡Individual ¡Health ¡Treatment ¡Costs ¡ $4.37 ¡ ¡ $11.95 ¡ ¡ $7.82 ¡ Carcass ¡Performance ¡ ¡ ¡ ¡ ¡Hot ¡Carcass ¡Weight ¡ 750 ¡ 703 ¡ 728 ¡ ¡ ¡Dressing ¡Percent ¡ 61.5% ¡ 60.7% ¡ 61.4% ¡ ¡ ¡Fat ¡Cover ¡ 0.45 ¡ 0.46 ¡ 0.46 ¡ ¡ ¡Ribeye ¡Area ¡ 12.7 ¡ 12.1 ¡ 12.4 ¡ ¡ ¡Ribeye ¡Area/cwt ¡of ¡Carcass ¡Weight ¡ 1.69 ¡ 1.72 ¡ 1.70 ¡ ¡ ¡Yield ¡Grade ¡(calculated) ¡ 2.84 ¡ 2.87 ¡ 2.88 ¡ ¡ ¡% ¡Low ¡Choice ¡or ¡Be\er ¡ 74.5% ¡ 52.6% ¡ 63.9% ¡ ¡ ¡% ¡Upper ¡Choice ¡or ¡Be\er ¡ 18.1% ¡ 6.3% ¡ 10.9% ¡ Profitability ¡ ¡ ¡ ¡ ¡Average ¡LifeJme ¡Profitability ¡ $168 ¡ ¡ $92 ¡ ¡ $131 ¡ ¡

slide-7
SLIDE 7

2014 TCSCF Sire Profit Analysis

Comparison ¡of ¡Top ¡Profit ¡Bulls ¡to ¡Bo3om ¡Profit ¡Bulls: ¡2010 ¡-­‑ ¡2014 ¡

¡ ¡

Sire ¡Groupings ¡

¡ ¡Trait ¡ Top ¡25% ¡ Bo3om ¡ 25% ¡ All ¡Sire ¡ Average ¡ Number ¡of ¡Sires ¡===> ¡ 191 ¡ 191 ¡ 764 ¡ Feedlot ¡Performance ¡ ¡ ¡ ¡ ¡Delivery ¡Weight ¡ 691 ¡ 633 ¡ 661 ¡ ¡ ¡SPA ¡Calf ¡Value ¡ $821 ¡ $769 ¡ ¡ $794 ¡ ¡ ¡Ave. ¡DisposiGon ¡Score ¡ 1.74 ¡ 1.77 ¡ 1.79 ¡ ¡ ¡Overall ¡ADG ¡ 3.52 ¡ 3.21 ¡ 3.36 ¡ ¡ ¡Final ¡Weight ¡ 1254 ¡ 1147 ¡ 1198 ¡ ¡ ¡Feed ¡to ¡Gain ¡ 6.68 ¡ 6.75 ¡ 6.72 ¡ ¡ ¡Feed ¡Cost/cwt ¡of ¡Gain ¡ $50.13 ¡ $50.61 ¡ ¡ $50.41 ¡ Health ¡Performance ¡ ¡ ¡ ¡ ¡Individual ¡Health ¡Treatment ¡Costs ¡ $7.60 ¡ $12.87 ¡ ¡ $9.87 ¡ Carcass ¡Performance ¡ ¡ ¡ ¡ ¡Hot ¡Carcass ¡Weight ¡ 775 ¡ 700 ¡ 736 ¡ ¡ ¡Dressing ¡Percent ¡ 61.8% ¡ 61.0% ¡ 61.4% ¡ ¡ ¡Fat ¡Cover ¡ 0.47 ¡ 0.47 ¡ 0.47 ¡ ¡ ¡Ribeye ¡Area ¡ 12.9 ¡ 12.1 ¡ 12.5 ¡ ¡ ¡Ribeye ¡Area/cwt ¡of ¡Carcass ¡Weight ¡ 1.66 ¡ 1.73 ¡ 1.70 ¡ ¡ ¡Yield ¡Grade ¡(calculated) ¡ 2.93 ¡ 2.92 ¡ 2.93 ¡ ¡ ¡% ¡Low ¡Choice ¡or ¡Be\er ¡ 78.5% ¡ 59.2% ¡ 69.3% ¡ ¡ ¡% ¡Upper ¡Choice ¡or ¡Be\er ¡ 18.6% ¡ 10.8% ¡ 14.6% ¡ Profitability ¡ ¡ ¡ ¡ ¡Average ¡LifeJme ¡Profitability ¡ $274 ¡ $128 ¡ ¡ $202 ¡ ¡

My calves used to grade 90% Choice and now they are 50% Choice.

The feedlot did not feed my calves the right way. They should have been fed longer. They were not fat enough. What about genetics? New sire is on the way First calf crop was 95% low Choice or better

% low Choice or Better by Profit Group

20 40 60 80 100 Least 5th 4th 3rd 2nd Most 43.8 59.4 67.5 73.6 78.2 82.6 % low Choice or Better

a b c e d f abcdef Means with unlike superscripts differ, P<0.05

Overall effect P<0.0001

% CAB by Profit Group

5 10 15 20 25 30 35 Least 5th 4th 3rd 2nd Most 7.3 12.1 14.8 18.3 22.0 28.4 % low Choice or Better

a b c e d f abcdef Means with unlike superscripts differ, P<0.05

Overall effect P<0.0001

% YG 1 & 2’s by Profit Group

25 30 35 40 45 50 55 60 65 Least 5th 4th 3rd 2nd Most 52.4 53.0 53.6 54.3 56.4 59.2 % YG 1&2

a b c e d f abcdef Means with unlike superscripts differ, P<0.05

Overall effect P<0.0001

slide-8
SLIDE 8

% YG 4 & 5’s by Profit Group

2 4 6 8 10 12 14 Least 5th 4th 3rd 2nd Most 10.9 4.4 2.7 1.8 1.4 0.8 % YG 4&5

a b c e d f abcdef Means with unlike superscripts differ, P<0.05

Overall effect P<0.0001

% low Choice or Better and YG 1&2’s by Profit Group

10 20 30 40 50 60 70 80 90 100 Least 5th 4th 3rd 2nd Most 43.8 59.4 67.5 73.6 78.2 82.6 52.4 53.0 53.6 54.3 56.4 59.2 % low Choice

  • r Better

% YG 1&2

abcdef Means with unlike superscripts differ, P<0.05

Overall effect P<0.0001

Marbling Scores for 4 USDA Quality Grades that are Deterministic in Grid Markets

Marbling = Slight Quality = Select Marbling = Small Quality = Choice - Marbling = Modest Quality = Choice 0 Marbling = Slightly Abundant Quality = Prime -

99 out of 100 98 out of 100 92 out of 100 83 out of 100

Grid Pricing The Basics

  • Base price $/cwt for Choice – YG 3

carcass

  • Premiums for Prime, upper 2/3’s Choice,

YG 1&2

  • Discounts for Select, Standards, YG 4’s &

5’s, light and heavy weight carcasses, stags, over 30 months, dark cutters, heiferettes and dairy conformation

$180.00 ¡ $190.00 ¡ $200.00 ¡ $210.00 ¡ $220.00 ¡ $230.00 ¡ $240.00 ¡ $250.00 ¡ $260.00 ¡ $270.00 ¡ $280.00 ¡ 11-­‑Apr ¡ 25-­‑Apr ¡ 9-­‑May ¡ 23-­‑May ¡ 6-­‑Jun ¡ 20-­‑Jun ¡ 4-­‑Jul ¡ 18-­‑Jul ¡ 1-­‑Aug ¡ 15-­‑Aug ¡ 29-­‑Aug ¡ 12-­‑Sep ¡ 26-­‑Sep ¡ 10-­‑Oct ¡ 24-­‑Oct ¡ 7-­‑Nov ¡ 21-­‑Nov ¡ 5-­‑Dec ¡ 19-­‑Dec ¡ 2-­‑Jan ¡ 16-­‑Jan ¡ 30-­‑Jan ¡ 13-­‑Feb ¡ 27-­‑Feb ¡

Base ¡Price ¡$/cwt ¡Choice ¡YG ¡3 ¡ TCSCF ¡Premium ¡Grid ¡

Choice ¡YG ¡3 ¡ $115.00 ¡ $125.00 ¡ $135.00 ¡ $145.00 ¡ $155.00 ¡ $165.00 ¡ $175.00 ¡ 11-­‑Apr ¡ 25-­‑Apr ¡ 9-­‑May ¡ 23-­‑May ¡ 6-­‑Jun ¡ 20-­‑Jun ¡ 4-­‑Jul ¡ 18-­‑Jul ¡ 1-­‑Aug ¡ 15-­‑Aug ¡ 29-­‑Aug ¡ 12-­‑Sep ¡ 26-­‑Sep ¡ 10-­‑Oct ¡ 24-­‑Oct ¡ 7-­‑Nov ¡ 21-­‑Nov ¡ 5-­‑Dec ¡ 19-­‑Dec ¡ 2-­‑Jan ¡ 16-­‑Jan ¡ 30-­‑Jan ¡ 13-­‑Feb ¡ 27-­‑Feb ¡

Live ¡Price ¡$/cwt ¡63% ¡Dress ¡ TCSCF ¡Premium ¡Grid ¡

Live ¡Price ¡63% ¡Dress ¡

slide-9
SLIDE 9

Grid Pricing The Basics

Average Premiums and Discounts April 11, 2015 to July 30, 2016

  • Premiums
  • Prime $20.57/cwt
  • CAB $8.08/cwt
  • YG 1 $6.50/cwt
  • YG 2 $2.50/cwt
  • Discounts
  • Select $-7.90
  • Standard $-24.20
  • YG 4 $-8.00
  • YG 5 $-12.00
  • 1050 lb. & over $-35.00/cwt
  • Dairy Conformation $-8.00/cwt
  • Other $-25.00

– Standard, Heiferettes, over 30 months, less than 550 lb. carcass

  • ­‑$40.00 ¡
  • ­‑$30.00 ¡
  • ­‑$20.00 ¡
  • ­‑$10.00 ¡

$0.00 ¡ $10.00 ¡ $20.00 ¡ $30.00 ¡ $40.00 ¡ 11-­‑Apr ¡ 25-­‑Apr ¡ 9-­‑May ¡ 23-­‑May ¡ 6-­‑Jun ¡ 20-­‑Jun ¡ 4-­‑Jul ¡ 18-­‑Jul ¡ 1-­‑Aug ¡ 15-­‑Aug ¡ 29-­‑Aug ¡ 12-­‑Sep ¡ 26-­‑Sep ¡ 10-­‑Oct ¡ 24-­‑Oct ¡ 7-­‑Nov ¡ 21-­‑Nov ¡ 5-­‑Dec ¡ 19-­‑Dec ¡ 2-­‑Jan ¡ 16-­‑Jan ¡ 30-­‑Jan ¡ 13-­‑Feb ¡ 27-­‑Feb ¡

Premiums ¡and ¡Discounts ¡ ¡ TCSCF ¡Premium ¡Grid ¡

Prime ¡ CAB ¡ Selects ¡ No ¡Roll ¡

TCSCF Quality Grid - $/cwt/Hot Carcass Wt.

Average Premiums and Discounts April 11, 2015 to July 30, 2016

Quality Grade Yield Grade 1 Yield Grade 2 Yield Grade 3 Yield Grade 4 Yield Grade 5 Prime $246.14 $242.14 $239.64 $231.64 Prem Choice $233.65 $229.65 $227.15 $219.15 Choice - $225.57 $221.57 $219.07 $211.07 $207.07 Select $217.67 $213.67 $211.17 $203.17 $199.17 Standard $194.87 $186.87 $182.87

TCSCF Quality Grid - $/cwt to Live Wt. Based on 63% Dress

Average Premiums and Discounts April 11, 2015 to July 30, 2016

Quality Grade Yield Grade 1 Yield Grade 2 Yield Grade 3 Yield Grade 4 Yield Grade 5 Prime $155.07 $152.55 $150.97 $145.93 Prem Choice $147.20 $144.68 $143.10 $138.06 Choice - $142.11 $139.59 $138.01 $132.97 $130.45 Select $137.13 $134.61 $133.04 $128.00 $125.48 Standard $122.77 $117.73 $115.21

Beef Carcass Merit Grid - $/800 lb carcass

Average Premiums and Discounts April 11, 2015 to July 30, 2016

Quality Grade Yield Grade 1 Yield Grade 2 Yield Grade 3 Yield Grade 4 Yield Grade 5 Prime $1969 $1937 $1917 $1853 Prem Choice $1869 $1837 $1817 $1753 Choice - $1805 $1773 $1753 $1689 $1657 Select $1741 $1709 $1689 $1625 $1593 Standard $1559 $1495 $1463

Carcass Price $/cwt by Profit Group

$140 $145 $150 $155 $160 $165 Least 5th 4th 3rd 2nd Most $142.01 $146.83 $149.50 $152.17 $155.54 $160.97 Carcass Price $/cwt

a b c e d f abcdef Means with unlike superscripts differ, P<0.05

Overall effect P<0.0001

slide-10
SLIDE 10

0% 10% 20% 30% 40% 50% 60% 70% 80% 90% 100% >1.0 1 0.9 0.8 0.7 0.6 0.5 0.4 0.3 0.2 0.1

Fat ¡Cover, ¡inches

Chart ¡2. ¡Low ¡Choice ¡& ¡Yield ¡Grade ¡1&2s ¡as ¡ Fat ¡Cover ¡Increases

% ¡Ch ¡or ¡Better % ¡YG2 ¡or ¡Better

If they don’t grade by .5” of fat cover the chances of doing it are slim to none!

Balancing Quality Grade and Yield Grade means walking a fine line

Quality Grade Yield Grade 70 % Choice and 70% YG 1&2’s

Summary of the Data

  • Years covered: 2002 – 2014
  • Number of Red Angus sired

calves: 1,997

  • Red Angus sired calves plus

dam breed: 1,426

  • Red Angus sired calves w/o

dam breed: 571

Numbers of Calves in the TCSCF Data by %Red Angus

Percent Red Angus Class Number of Calves 0-24% (all 0%) 47,241 25-49% 446 50-74% 929 75-100% 784 0.00% 25.17 % 50.01 % 83.26 % 0.00% 10.00% 20.00% 30.00% 40.00% 50.00% 60.00% 70.00% 80.00% 90.00%

  • 2

4 2 5

  • 4

9 5

  • 7

4 7 5

  • 1

%Red Angus

%Red Angus

Feedlot In and Out-Weights

657.9 605.6 619.6 582.9 1193.9 1184.9 1187.2 1159.7

200 400 600 800 1000 1200 1400 0-24 25-49 50-74 75-100 In Weight/lbs Out Weight/lbs

a b b c a a a

b

abc Means with unlike superscripts differ P<.0001

Delivery Age by % Red Angus

307 293 281 307 265 270 275 280 285 290 295 300 305 310 0-24 25-49 50-74 75-100

Delivery Age - Days

Delivery Age - Days

a b b a

slide-11
SLIDE 11

Average Daily Gain and Feed:Gain

3.27 3.26 3.21 3.22 6.84 6.49 6.52 6.56 1 2 3 4 5 6 7 8 Category 1 Category 2 Category 3 Category 4 ADG F:G

a b b b a ab b ab ab Means with unlike superscripts differ P<.0001

Individual Treatment Cost by % Red Angus

$7.31 $8.71 $10.94 $10.25 $0.00 $2.00 $4.00 $6.00 $8.00 $10.00 $12.00 0-24 25-49 50-74 75-100

$/hd

$/hd

ab b b a

ab Means with unlike superscripts differ P<.0001

Profit - $/head by % Red Angus

$45.92 $79.83 $25.03 $57.46 $0.00 $10.00 $20.00 $30.00 $40.00 $50.00 $60.00 $70.00 $80.00 $90.00 0-24 25-49 50-74 75-100

Profit: $/hd

Profit: $/hd

b c ab a

abc Means with unlike superscripts differ P<.0001

Feed Cost and Total Cost per Pound of Gain by % Red Angus

$0.00 $10.00 $20.00 $30.00 $40.00 $50.00 $60.00 $70.00 $80.00 0-24 25-49 50-74 75-100 Feed Cost/lb gain Total Cost of Gain

12th/13th Rib Fat and Ribeye Area by % Red Angus

0.46 0.42 0.41 0.43 12.44 12.63 12.74 12.26 2 4 6 8 10 12 14 0-24 25-49 50-74 75-100 Fat thickness, Inches REA, Sq.In.

a b b b a b b b

Marbling Score by % Red Angus

434 425 407 431 390 395 400 405 410 415 420 425 430 435 440 0-24 25-49 50-74 75-100

Marbling Score

Marbling Score

a a b a

slide-12
SLIDE 12

People are the difference!! Best Management Practices Have No Boundaries

  • Cow-calf producers who retain ownership are

financially responsible for genetics, health and management of their calves

  • Early adopters of genetic evaluation tools
  • Utilize a team of advisors to adopt available

technologies to improve calf health and performance

  • Tired of someone else benefiting from their

efforts in health and management

  • Believe in working and sharing information with
  • ther producers

Advantages to Cow-Calf Producers

  • TCSCF started as a way to add profit
  • Still is the number one goal

– Profit is gross income – minus cost of production

  • Over 55% of the cattle we feed are from

producers with less than 80 calves available to feed

  • Our methods of sorting, marketing, and volume of

cattle adds $38/head to all cattle we feed

  • Benchmarking other cattle of similar sex, weight

and age on arrival allows for improvement in weaknesses without harming strengths

Disadvantages to Cow-Calf Producers Retaining Ownership

  • You are now responsible for the cattle you have

produced

  • Telling a cow-calf producer his calves are not the

best is worse than saying his daughter is real ugly

  • 35% of the producers are pleasantly surprised

how good their calves are

  • 55% are in the middle and look for ways to

improve

  • 10% are disappointed and think the TCSCF

program is the worst idea in the world

Things we over estimate the value or importance of

Location or Zip Code Other than transportation to cheapest feed source Breed Range in profit by sire is similar across all breeds

Things we under estimate the value or importance of

Health Genetics People People make management decisions including genetic decisions

slide-13
SLIDE 13

The TCSCF Program

  • Economically relevant traits
  • Farm families working with farm

families

  • Sharing information
  • People working together as a team to

solve problems and improve profits

  • We have many trusted partners

Why has TCSCF Succeeded?

  • People working together to solve problems
  • When times were tough they choose to make or had to

make changes to survive

– 1980’s bank closings, producer bankruptcies, lack of profits – Early 1990’s to today lack of young people entering the beef industry – SW Iowa feedlots were competitive and wanted to assist new custom feedlots

  • Group counseling
  • Willing to share information to make improvements to

compete in the protein business

  • Win – win – win Cow-calf, feedlots and Extension

The end

More Detailed Reports

  • TCSCF.com

– Sire summaries – Research updates

  • IowaBeefCenter.org

– Research reports – Summaries of Cull Cows & Tenderness Projects

  • Call 712.769.2600
  • Matt Groves, TCSCF Coordinator