
SLIDE 1
What Are You Looking at?
Jerry Gilfoyle The Zeeman Effect 1 / 17
What Are You Looking at? Jerry Gilfoyle The Zeeman Effect 1 / 17 - - PowerPoint PPT Presentation
What Are You Looking at? Jerry Gilfoyle The Zeeman Effect 1 / 17 What Are You Looking at? 1 Hint: It makes these happen. Jerry Gilfoyle The Zeeman Effect 1 / 17 What Are You Looking at? 1 Hint: It makes these happen. 2 This a magnetogram
Jerry Gilfoyle The Zeeman Effect 1 / 17
1 Hint: It makes these happen. Jerry Gilfoyle The Zeeman Effect 1 / 17
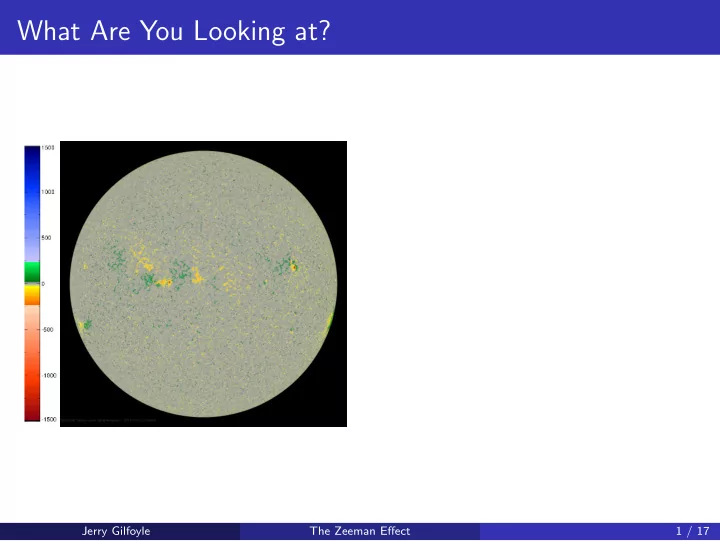
1 Hint: It makes these happen. 2 This a magnetogram from the
Jerry Gilfoyle The Zeeman Effect 1 / 17
1 Hint: It makes these happen. 2 This a magnetogram from the
3 It shows the magnetic field
Jerry Gilfoyle The Zeeman Effect 1 / 17
1 Hint: It makes these happen. 2 This a magnetogram from the
3 It shows the magnetic field
4 The legend shows the field
Jerry Gilfoyle The Zeeman Effect 1 / 17
1 Hint: It makes these happen. 2 This a magnetogram from the
3 It shows the magnetic field
4 The legend shows the field
5 Understanding the Sun’s magnetic
Jerry Gilfoyle The Zeeman Effect 1 / 17
1 Hint: It makes these happen. 2 This a magnetogram from the
3 It shows the magnetic field
4 The legend shows the field
5 Understanding the Sun’s magnetic
6 Why should you care? Ask him. Jerry Gilfoyle The Zeeman Effect 1 / 17
Jerry Gilfoyle The Zeeman Effect 2 / 17
1
Jerry Gilfoyle The Zeeman Effect 2 / 17
1
2
Jerry Gilfoyle The Zeeman Effect 2 / 17
1
2
3
Jerry Gilfoyle The Zeeman Effect 2 / 17
1
2
3
4
Jerry Gilfoyle The Zeeman Effect 2 / 17
1
2
3
4
5
Jerry Gilfoyle The Zeeman Effect 2 / 17
1
2
3
4
5
6
Jerry Gilfoyle The Zeeman Effect 2 / 17
1
2
3
4
5
6
Jerry Gilfoyle The Zeeman Effect 2 / 17
Jerry Gilfoyle The Zeeman Effect 3 / 17
Discrete States Continuum States 2 4 6 8
5 Energy (eV) Jerry Gilfoyle The Zeeman Effect 4 / 17
Discrete States Continuum States 2 4 6 8
5 Energy (eV) Jerry Gilfoyle The Zeeman Effect 4 / 17
Jerry Gilfoyle The Zeeman Effect 5 / 17
Jerry Gilfoyle The Zeeman Effect 6 / 17
Jerry Gilfoyle The Zeeman Effect 7 / 17
Jerry Gilfoyle The Zeeman Effect 8 / 17
Jerry Gilfoyle The Zeeman Effect 9 / 17
Jerry Gilfoyle The Zeeman Effect 10 / 17
Jerry Gilfoyle The Zeeman Effect 11 / 17
Jerry Gilfoyle The Zeeman Effect 11 / 17
Jerry Gilfoyle The Zeeman Effect 13 / 17
Jerry Gilfoyle The Zeeman Effect 14 / 17
Jerry Gilfoyle The Zeeman Effect 15 / 17
Jerry Gilfoyle The Zeeman Effect 16 / 17
Jerry Gilfoyle The Zeeman Effect 17 / 17