
SLIDE 1
Welcome Dimensions - Indian Grid & Electricity Market 3.2 - - PowerPoint PPT Presentation
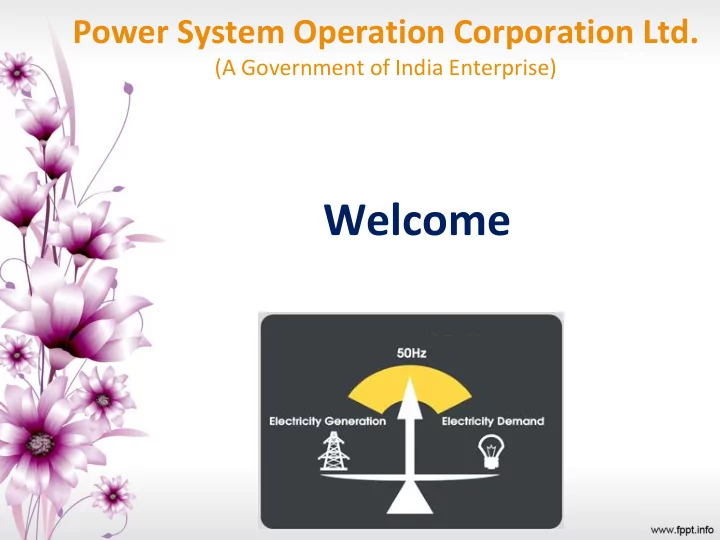
Power System Operation Corporation Ltd. (A Government of India Enterprise) Welcome Dimensions - Indian Grid & Electricity Market 3.2 million km 340 GW+ 2.5 GW+ area footprint generation capacity international 1.3 Billion+ exchanges
2
3
Pre 1991:
Five Regional Grids - Five Frequencies
October 1991:
East and Northeast synchronized
March 2003:
West synchronized with East & Northeast
August 2006: North
synchronized with Central Grid
Dec 2013:
All India Synchronized Grid
Maps not to scale
Electricity Act, 2003 Merchant Power Merging of Markets 1000 MW units and HVDC, 765 kV, UMPP, Common Carrier - Transmission 175 GW Renewables, Cross Border Interconnections, Distribution System Operators (DSOs), Storage, Electric Vehicles, Micro-Grids
Operation through Six Control Centres
(RLDCs)
NLDC, Delhi NRLDC, Delhi WRLDC, Mumbai SRLDC, Bengaluru ERLDC, Kolkata NERLDC, Shillong
January, 2017
National Importance
‘Vital link’ between the administrators, planners & regulators on one end and physical system and market players on the other end
5
Competition Regulated Regulated Competition Statutory Statutory Statutory
Generation Transmission Distribution
Mission of POSOCO
“Ensure Integrated Operation of Regional and National Power Systems to facilitate transfer of electric power within and across the regions and trans-national exchange of power with
Reliability, Security and Economy”
National Load Despatch Centre (NLDC) Regional Load Despatch Centre (RLDC) State Load Despatch Centre (SLDC)
7
Operational Planning
and emergency outages
capability of the network
black start mock drills Real Time Operation
system parameters
line loadings
Situational Awareness Post Despatch Analysis
CEA and CTU
Power Supply Position
Generation
Transmission
RTU Sub LDC SLDC RLDC NLDC
Plant/Sub Station Level District Level State Level Regional Level National Level
8
Typical All India Load Curve
Monsoon Summer Winter Solar Hydro Wind Pumped Hydro Diurnal Variation Seasonal Variation
Morning & Evening Peak @ 500 – 600 MW/min for 1 hour
– To meet forecasted demand – For evacuation of power from generating stations – For system strengthening (To achieve network security aspects)
– Inter-state transmission system (ISTS) – Intra-state transmission system (Intra-STS)
– Evacuation of power from inter-state generation stations which have beneficiaries in more than one state. – Onward transmission of power for delivery of power from inter-state generation stations up to the delivery point of the state grid. – Transfer of operational surpluses from surplus state(s) to deficit state(s) or from surplus region(s) to deficit region(s) as need under relevant regulation
– Evacuation of power from state’s generating (both under state and private sector) stations having beneficiaries in that State – Onward transmission of power within the State from ISTS boundary up to the various substations of the state grid – Transmission within the state grid for delivery of power to the load centers within the state
– Prepare perspective generation and transmission plans and coordinate the activities of planning agencies [Sec 73 of Electricity Act] – Formulate short-term and perspective plans for development of the electricity system [Para 3.2 of National Electricity Policy] – Frame National Electricity Plan [Sec 3(4) of Electricity Act] – Considerations in National Electricity Plan:
transmission
development of national grid
distribution
considerations
– Network planning and development in accordance with National Electricity Plan – Discharge all functions of planning and co-ordination related to inter-state transmission system (ISTS) with [As per Sec 38(2) of Electricity Act(EA)]
– Planning to be done in accordance with National Electricity Plan of CEA
– Network planning and development in accordance with National Electricity Plan – Nodal agency for Intra-STS planning in coordination with distribution licensees and intra-state generators connected/to be connected in the STU grid [Sec 39 of EA]
– 1st Criteria issued in 1985, setting philosophy for regional self sufficiency – Revised in 1994 – Latest revision : 2013 – It covers :
– all the equipments shall remain within their normal thermal loadings and voltage ratings – angular separation between adjacent buses shall not exceed 30 degree
– All the equipments in the transmission system shall remain within their normal thermal and voltage ratings after a disturbance involving N-1 contingency, without load shedding / rescheduling of generation – The angular separation between adjacent buses under (‘N-1’) conditions shall not exceed 30 degree – Transmission system shall be stable after it is subjected to one of the disturbances as specified
– The system shall be able to survive a temporary single phase to ground fault
phase and successful re-closure (dead time 1 second) shall be considered. – The system shall be able to survive a permanent single phase to ground fault
faulted phase and unsuccessful re-closure (dead time 1 second) followed by 3-pole opening (100 ms) of the faulted line shall be considered. – In case of 220kV / 132kV networks, the system shall be able to survive a permanent three phase fault on one circuit, close to a bus, with a fault clearing time of 160 ms (8 cycles) assuming 3-pole opening.
– Power Flow Studies – Short Circuit Studies – Stability Studies (including transient stability and and voltage stability) – EMTP studies (for switching / dynamic over-voltages, insulation coordination, etc)
52034 79455 115742 147531 192535 248049 377520
1985 1990 1997 2002 2007 2012 2018
Circuit Kms 1985 1990 1997 2002 2007 2012 2018 HVDC 1634 4738 5872 9432 15556 765kV AC 1160 2184 5250 35301 400kV AC 6029 19824 36142 49378 75722 106819 172263 220kV AC 46005 59631 79600 96993 114629 135980 169956 Total 52034 79455 115742 147531 192535 248049 377520
46621 75322 125042 181943 257639 409551 834878
1985 1990 1997 2002 2007 2012 2018
MVA 1985 1990 1997 2002 2007 2012 2018 765kV AC 25000 194500 400kV AC 9330 21580 40865 60380 92942 151027 284197 220kV AC 37291 53742 84177 116363 156497 223774 333681 HVDC 5200 8200 9750 22500 Total 46621 75322 125042 181943 257639 409551 834878
– Plan for additional transmission network?
– Agra HVDC – Low Short-circuit ratio of NER Grid (Voltage swings / surges) – Bi-directional flow on HVDC link