
http://www.cs.ubc.ca/~tmm/courses/journ16
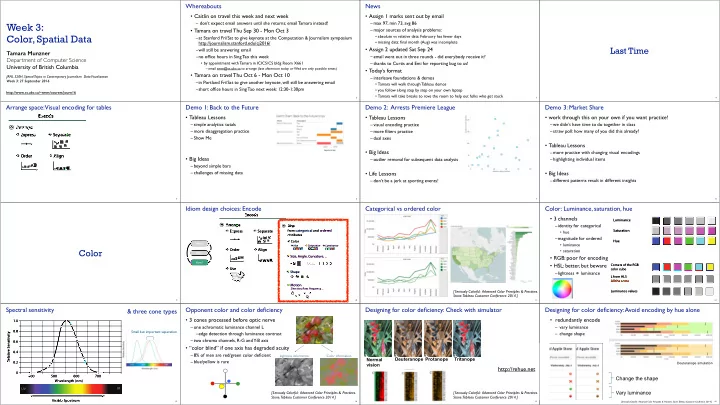
Week 3: Color, Spatial Data
Tamara Munzner Department of Computer Science University of British Columbia
JRNL 520H, Special Topics in Contemporary Journalism: Data Visualization Week 3: 27 September 2016
Whereabouts
- Caitlin on travel this week and next week
– don’t expect email answers until she returns; email Tamara instead!
- Tamara on travel Thu Sep 30 - Mon Oct 3
–at Stanford Fri/Sat to give keynote at the Computation & Journalism symposium http://journalism.stanford.edu/cj2016/ –will still be answering email –no office hours in Sing Tao this week
- by appointment with Tamara in ICICS/CS bldg Room X661
– email tmm@cs.ubc.ca to arrange (late afternoon today or Wed are only possible times)
- Tamara on travel Thu Oct 6 - Mon Oct 10
–in Portland Fri/Sat to give another keynote, will still be answering email –short office hours in Sing Tao next week: 12:30-1:30pm
2
News
- Assign 1 marks sent out by email
–max 97, min 73, avg 86 –major sources of analysis problems:
- absolute vs relative data: February has fewer days
- missing data: final month (Aug) was incomplete
- Assign 2 updated Sat Sep 24
–email went out in three rounds - did everybody receive it? –thanks to Curtis and Emi for reporting bug to us!
- Today’s format
–interleave foundations & demos
- Tamara will walk through Tableau demos
- you follow along step by step on your own laptop
- Tamara will take breaks to rove the room to help out folks who get stuck
3
Last Time
4 5
Encode Arrange Express Separate Order Align
Arrange space: Visual encoding for tables Demo 1: Back to the Future
- Tableau Lessons
–simple analytics: totals –more disaggregation practice –Show Me
- Big Ideas
–beyond simple bars –challenges of missing data
6
Demo 2: Arrests Premiere League
- Tableau Lessons
–visual encoding practice –more filters practice –dual axes
- Big Ideas
–outlier removal for subsequent data analysis
- Life Lessons
–don’t be a jerk at sporting events!
7
Demo 3: Market Share
- work through this on your own if you want practice!
–we didn’t have time to do together in class –straw poll: how many of you did this already?
- Tableau Lessons
–more practice with changing visual encodings –highlighting individual items
- Big Ideas
–different patterns result in different insights
8
Color
9
Idiom design choices: Encode
10
Why? How? What?
Encode Arrange Express Separate Order Align Use
Map Color Motion Size, Angle, Curvature, ...
Hue Saturation Luminance
Shape
Direction, Rate, Frequency, ...
from categorical and ordered attributes
Categorical vs ordered color
11
[Seriously Colorful: Advanced Color Principles & Practices. Stone.Tableau Customer Conference 2014.]
Color: Luminance, saturation, hue
- 3 channels
–identity for categorical
- hue
–magnitude for ordered
- luminance
- saturation
- RGB: poor for encoding
- HSL: better, but beware
–lightness ≠ luminance
12
Saturation Luminance values Hue Corners of the RGB color cube L from HLS All the same Luminance values
Spectral sensitivity
13
Wavelength (nm) IR UV Visible Spectrum Small but important separation
& three cone types Opponent color and color deficiency
- 3 cones processed before optic nerve
–one achromatic luminance channel L –edge detection through luminance contrast –two chroma channels, R-G and Y-B axis
- “color blind” if one axis has degraded acuity
–8% of men are red/green color deficient –blue/yellow is rare
14
Lightness information Color information
[Seriously Colorful: Advanced Color Principles & Practices. Stone.Tableau Customer Conference 2014.]
Designing for color deficiency: Check with simulator
15
Deuteranope Protanope Tritanope Normal vision
[Seriously Colorful: Advanced Color Principles & Practices. Stone.Tableau Customer Conference 2014.]
http://rehue.net
Designing for color deficiency: Avoid encoding by hue alone
- redundantly encode
– vary luminance – change shape
16
Change the shape Vary luminance
Deuteranope simulation
[Seriously Colorful: Advanced Color Principles & Practices. Stone.Tableau Customer Conference 2014.]