
SLIDE 1
Weve got some issues.... The Dominion-Post The scale of dirty - - PowerPoint PPT Presentation
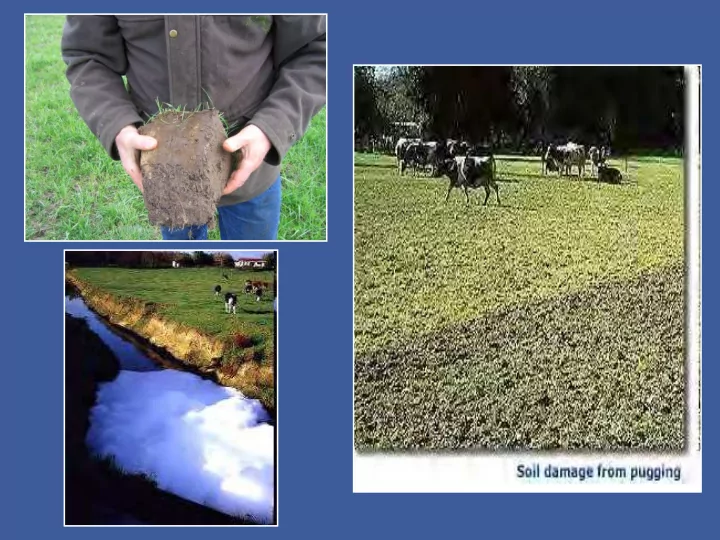
Weve got some issues.... The Dominion-Post The scale of dirty dairying in this country: Figures obtained from the 17 regional councils and unitary authorities reveal that since July 1, 2008, there have been 151 prosecutions involving more than
The Dominion-Post The scale of dirty dairying in this country: Figures obtained from the 17 regional councils and unitary authorities reveal that since July 1, 2008, there have been 151 prosecutions involving more than 300 charges against 198 companies or individuals for unlawful discharges of dairy effluent affecting land or water.
DID YOU KNOW? Our food today is LESS NUTRITIOUS than before WWII!
1940-1991
Fruits
Lost 19% of their copper
Lost 29% of their sodium
Lost 24% of their iron
Lost 15% of their magnesium
Lost 22% of potassium
Chemistry, UK
engineering, conventional precision farming practices, how is it possible that all this technological advancement has actually reduced food nutritional value?
N, P, K, S
insecticides without considering the impact these have on our production system.
issues we created with our imperfect plant nutrition.
can be rectified by building healthy soils, healthy plants and healthy animals.
NZ Fertiliser use in the last 25 years – 6 X More Nitrogen use
200 400 600 800 1 000 1 200 1 400 1 600 1981 1983 1985 1987 1989 1991 1993 1995 1997 1999 2001 2003 2005 2007
Fert application in tonnes (Thousands) Year
Fertiliser application in New Zealand from 1981
Super -phosphate Urea Diammonium Phosphate (DAP) Ammonium sulphate
Source: MAF. "Fertiliser use statistics". (2007)
Summary of Farm Performance Improvement at Cloverdale
Before Abron (05/06-08/09) With Abron (09/10-11/12) % Change Pasture Harvested
15.25Tonnes/ha 16.83 Tonnes/ha
10.3 % Supplement cost/cow
$449 $390
Total MS Production 1,096,050kg 1,183,642kg 8% Cost per kg of MS $4.06 $3.48
Nitrogen applied 273units/ha 124 units/ha
Profit/ha (EBIT) $4,425/ha $5,763/ha 24 % Animal Health Costs $252,223/yr $194,545/yr
Performance data above has been based lined at a $7 milk solid payout for all
the same rate for all years. This is done to show how the engine room of the business is performing over time.
enzymes, antibiotics
Microbes are the bridge between the soil and the plant.
Every modern fertiliser we use damages this bridge in some way. Every herbicide and fungicide application also disrupts the nutrient delivery to plants
Effect
groundwater
disease problems in both the plants and the animals eating them.
improves soil biological activity and soil fertility through full spectrum mineral and biochemical applications
– Humus creation – Optimum nutrient quality – Plant and animal health – Profit
Ensure we have enough of these present to
maximise plant growth.
Soil humus - stable, very complex, microbe-rich carbon “the gold standard for ag sustainability”:
– Food & home for microbes – Increases soil water holding capacity – Chelates & holds fert in root zone for plant use – Keeps soil aerobic
nitrous
formation – Detoxifies pesticides – Carbon dioxide stored in living soil – The best measure of soil health
74,000 tonnes of nitrogen gas hovers above every hectare but we must have diverse soil microbiology to access and use it.
Graham Shepherd of Bio Agronomics in conjunction with the Regional Councils
soil health
and plant performance
– Soil health – Plant health – Nutrient cycling potential – Potential nutrient loss – Potential carbon sequestration
Progress towards a healthy soil is a step by step process
expect to maintain current production
biological activity
established methods
Humus formation and soil regeneration in action
HB Sheep and beef block October 2008.
Two weeks post grazing September 2011
Average annual inputs
550 kg/Ha Calci-life,Super-life, lime and serpentine based mix
– $140/Ha
0.0% 2.0% 4.0% 6.0% 8.0% 10.0% 6.7% 2.7% 8.8% 5.6% 4.9% 3.2%
Total Carbon %
Total soil C% on three Dairy pastures compared with adjacent conventional dairy soils
Increases in organic matter levels in soils (measured as Total Carbon) averaged 0.75 of a percent over 14 months on 16 monitor sites on seven Hawkes Bay dairy farms that were following an Abron fertiliser programme. This contrasts with trends of reducing soil carbon levels found in studies completed on Waikato dairy farms following a traditional soluble fertiliser programme
50 100 150 200 250 300 350 400 Kg Dm/ha per unit of N applied Average for nine harvests
Average pasture production per unit of N fertiliser applied at nine harvest dates from plots treated with dissolved urea and humic compounds or granular urea.
Dissolved Urea Granular Urea
received 9 units N per ha with humic compounds at each application
received 25 units N per ha per application
availability of nutrients is magnified.
– P x 7 – K x 10 – N x 5 – Mg x 3 – Ca x 1.5