
SLIDE 1
WBMT Continental Regions
Worldwide Network for Blood and Marrow Transplantation
NGO in official relations with World Health Organization
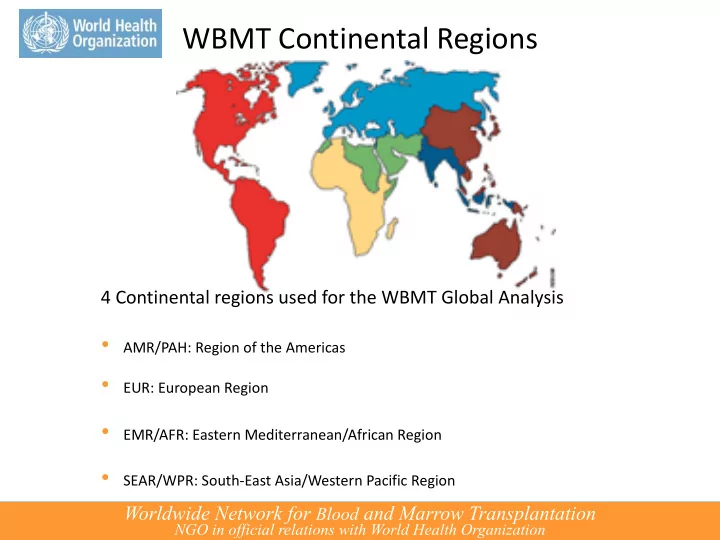
4 Continental regions used for the WBMT Global Analysis
- AMR/PAH: Region of the Americas
- EUR: European Region
- EMR/AFR: Eastern Mediterranean/African Region
- SEAR/WPR: South-East Asia/Western Pacific Region