Water Chemical formula H 2 0. The existence of strong hydrogen bond - - PowerPoint PPT Presentation

water
SMART_READER_LITE
LIVE PREVIEW

Water Chemical formula H 2 0. The existence of strong hydrogen bond - - PowerPoint PPT Presentation

Water Chemical formula H 2 0. The existence of strong hydrogen bond Exists in nature as Ice, water and vapour. Melting point 0 C, boiling point 100 C. Specific heat (water): 1 calorie/gm/degree C. Second highest! very important for


slide-1
SLIDE 1

Water

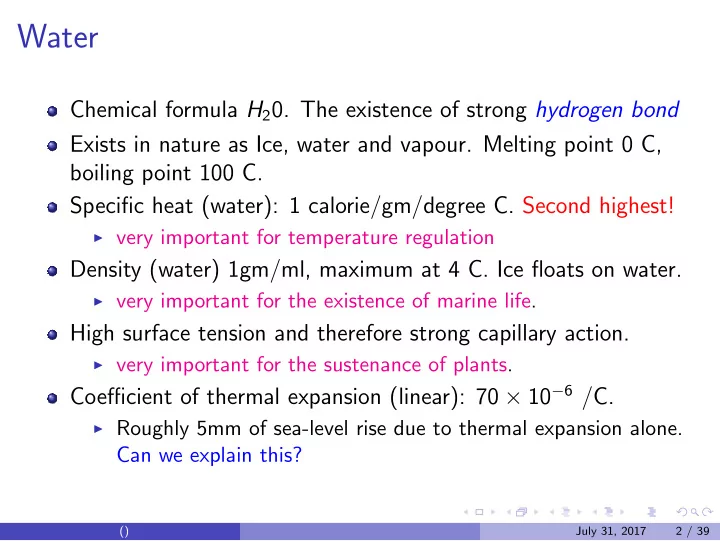
Chemical formula H20. The existence of strong hydrogen bond Exists in nature as Ice, water and vapour. Melting point 0 C, boiling point 100 C. Specific heat (water): 1 calorie/gm/degree C. Second highest!

◮ very important for temperature regulation

Density (water) 1gm/ml, maximum at 4 C. Ice floats on water.

◮ very important for the existence of marine life.

High surface tension and therefore strong capillary action.

◮ very important for the sustenance of plants.

Coefficient of thermal expansion (linear): 70 × 10−6 /C.

◮ Roughly 5mm of sea-level rise due to thermal expansion alone.

Can we explain this?

() July 31, 2017 2 / 39

slide-2
SLIDE 2

Life and water

Roughly 60% of body weight is water. Water-key ingredient in most life processes-photosynthesis, energy transfer in animals, and so on. Life as we know it is water-centric (and organic carbon-centric). Water in the solar system:

◮ Mercury atmosphere- roughly 4% ◮ Enceladus (a moon of Saturn)- 91 % ◮ recently-traces on the Moon.

In general, earth is the only body which is (i) at the right distance from the sun, (ii) has a strong enough gravity to retain an atmosphere, and (iii) has water. Besides, early civilizations also revolved around water.

() July 31, 2017 3 / 39

slide-3
SLIDE 3

Water on Earth

Roughly 71 % of earth’s area are the oceans, i.e., about 36 b.Ha.

◮ Average depth of oceans: 3790m. ◮ Salt content: 3%

source:Wikipedia.

() July 31, 2017 4 / 39

slide-4
SLIDE 4

Water availability

Total renewable (defined using the water cycle) per-capita, per year. Country

  • cu. m.

Congo 275,000 Canada 94,000 Brazil 48,000 Mongolia, Indonesia 13,000 Japan, Italy, Iraq 3300 Pakistan 2700 China 2200 Germany , Ethiopia 1800 India , Netherlands 1200 Israel 275 Roughly 4000 cu.km fall on India, of which roughly 690 cu.km. are used as surface water and about 430 cu. km. as ground water.

() July 31, 2017 5 / 39

slide-5
SLIDE 5

The main sectors

Use India Developed Countries Agricultural 85% 25 % Industrial 8 % 60 % Domestic 7 % 15 % Indian Hall-marks: Very low charges for agricultural water (Rs. 0.10 /cu.m.). Roughly Rs. 10 per cu.m. for domestic use, and Rs. 50 for industrial use. Investment of Rs. 150-200 required to develop a cubic meter of renewable resource. Poor domestic use network. Limited use of water saving practices in agricluture.

() July 31, 2017 6 / 39

slide-6
SLIDE 6

Agriculture

330 m.Ha, total, 180 m. Ha cultivable area. 110 m.Ha. irrigation potential, 54 m. Ha actually under irrigation. Only 25-30 % irrigation through canals. More than 50 % through tube-wells and open-wells. indication of poor canal infrastructure. Two typical water allocation systems, shejpali (pre-bid allocation), and wadabandi, fixed rotation. Typical billing, if at all, is per crop-acre and not volumetric.

() July 31, 2017 7 / 39

slide-7
SLIDE 7

Water needs

Substance Needs (in liters) 1kg Rice 1900 1kg Chicken 3300 1kg Wheat 1000 1kg Wool 150 1kg Sugar 3000 1kg Gur 1000 The numbers depend on the technology used. Drip Irrigation will typically reduce consumption by about 25-30 %. So why is there so much ruckus about sugarcane?

() July 31, 2017 8 / 39

slide-8
SLIDE 8

Fishing

Besides being a food, Fish is also an important source of protein. Here is the fishing data for 2004 (F.A.O). Amounts are in million tonnes. Country Wild Farms Per-Capita/year (kg) World 94 45 23 India 3.4 2.8 6.2 Iceland 1.8 ?? Here is the consumption data (in kg. per capita/year): France 28 Japan 60 China 28 Brazil 6 USA 21 UAE 27 Yemen 7 India 5 India is thus a fish-exporter! Wild production: 3kg/Ha. Farm: 2000 kg/Ha.

() July 31, 2017 9 / 39

slide-9
SLIDE 9

Industrial Use

40,000 million cubic meters were consumed by indian industry in 2001. Thermal Power plants consumed 87% of this water. Engineering, Paper and Textiles consumed 5% , 2 % and 2% respectively. Poor industrial productivity per cubic meter: $ 7 /cu.m. 10-80 cu.m. per tonne of steel, no water recycling. In US 10 cu.m./tonne, full recycling. In power generation, again 80 cu.m. per Mwh, while global norm is 10-20. http://www.cseindia.org/dte-supplement/industry20040215/ non-issue.htm

() July 31, 2017 10 / 39

slide-10
SLIDE 10

Domestic Use

Rough International Urban norm: 200 lpcd. Mumbai, roughly that, or a bit higher. Bangkok, London similar. Delhi, Chennai lower. Most cities in India plan for 150 lpcd or higher. Surprisingly, rural design norm is 40 lpcd! Habitation is in stress if 40 lpcd is not met at any point of time within 2 km of the habitation.

What is domestic use

Ablutions, Washing clothes, vessels, cleaning house. Drinking, cooking. Cattle? Livelihoods?

() July 31, 2017 11 / 39

slide-11
SLIDE 11

The basic movement of water

source: USGS.

() July 31, 2017 12 / 39

slide-12
SLIDE 12

The basic process

Going Up Oceans, Lakes and streams to Atmosphere-Evaporation Direct loss of moisture from the soil-Evapo-Transpiration Loss from vegetation-Transpiration

◮ depends on solar intensity, humidity and air flow.

Formation of liquid-water in the Atmosphere-Cloud-Formation Coming Down Rain/Snow-Condensation and Precipitation Drainage of rainwater into streams and rivers-Runoff Seepage of rainwater into the ground -Infiltration/Recharge

() July 31, 2017 13 / 39

slide-13
SLIDE 13

What happens when it rains

  • runoff

water table precipitation transpiration seepage Groundwater Subsurface water Air recharge

Precipitation: world average of about 800mm annual. Evaporation, Transpiration: from surface to air. Recharge: surface to ground Seepage, Baseflow: from ground to surface

() July 31, 2017 14 / 39

slide-14
SLIDE 14

Evapo-transpiration

Photosynthesis: The process by which a plant grows, coverting water and CO2. This as well as loss of water through leafs is called evapo-transpiration. Rice (Kharif) 800mm 100 days Well-drained Wheat (Rabbi) 500mm 100 days Well drained Cotton (K. Long) 700mm 140 days Black Bajri (Rabbi) 350mm 110 days Black Sugarcane 1800mm 15 mo. All Pomegranate 1200mm 12 mo. Well drained Seasonal Grass 200mm 2 mo. All Scrub 400mm 12 mo. All Forest +700mm 12 mo. All

() July 31, 2017 15 / 39

slide-15
SLIDE 15

ET loads

1 Ha. of Wheat will require a minimum of 5000 cu. m. of water. ET loads depend on planting method, row-width and climate. The above is indicative. It does not depend on irrigation method. It essentially is the water a healthy plant will require. Excess watering will either (i) drain, (ii) go into the ground, or (iii) evaporate from moist soil.

() July 31, 2017 16 / 39

slide-16
SLIDE 16

ET load graphically

J S O N J F M J J A D A M Long Kharif Rabbi Summer Annual point 1 critical critical point 2 Rain

Run−Off

() July 31, 2017 17 / 39

slide-17
SLIDE 17

The basic stocks and flows

Atmospheric Water Sub−surface Water Groundwater Surface Water Ocean−water

Runoff Baseflow Recharge Extraction Precipitation Transpiration Evapo−

Air Moisture: Clouds end in the Troposphere (about 35,000 ft). Surface: Rivers, streams and

  • glaciers. Man-made

reservoirs.

◮ Subsurface: Soil Moisture.

Groundwater: under the water table.

() July 31, 2017 18 / 39

slide-18
SLIDE 18

A toy model-Germany

Rainfall 859 mm/yr Runoff 192 mm/yr Evapo- transpiration 532mm/yr Groundwater flows 135mm/yr

() July 31, 2017 19 / 39

slide-19
SLIDE 19

Basic Stocks

Sub-surface water: water in the top 1m of soil. Equivalent to 20-50 mm of water. Infiltration after rain. Water application for agriculture. Recharge into GW, Evapo-transpiration. Groundwater: Below sub-surface. Recharge from sub-surface. Recharge from rivers, lakes and reservoirs. Baseflows into sea, rivers and streams. Extraction.

() July 31, 2017 20 / 39