
SLIDE 1
Walk on Water Presentation
EDSGN 100 Section 014 Team 6, Submission 10/19/2017 Jon Earley, James Gaus, Alec Joshi, Jessica Kostic
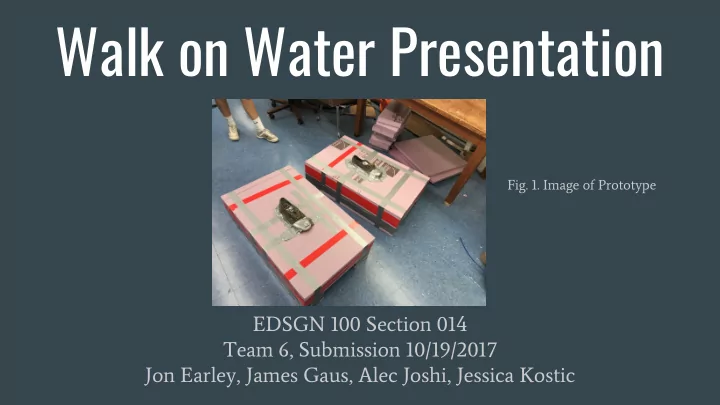
- Fig. 1. Image of Prototype
Walk on Water Presentation Fig. 1. Image of Prototype EDSGN 100 - - PowerPoint PPT Presentation
Walk on Water Presentation Fig. 1. Image of Prototype EDSGN 100 Section 014 Team 6, Submission 10/19/2017 Jon Earley, James Gaus, Alec Joshi, Jessica Kostic Table of Contents 1. Problem Definition 2. Brainstorming Process 3. Evaluation of
EDSGN 100 Section 014 Team 6, Submission 10/19/2017 Jon Earley, James Gaus, Alec Joshi, Jessica Kostic
The Six have the opportunity to design and create shoes for less than $60 and sell them for $100 that consumer ages 8-21 will purchase to walk on water, mainly for recreational fun. The prototype will be constructed, tested, and then modified to create the best possible final product.
The Opportunity presented to The Six is to design and develop shoes that allow consumers to walk on water for recreational fun.
Retailers, Angel Investors, Our Professor, Creators of the product
and children
A sustainable product is socially acceptable, eco-friendly, economically favorable, and technologically appropriate.
Table 1. Specifications Table 2. Pairwise Comparison
Table 3. Concept Screening Table 4. Concept Scoring
Table 5. Calculations
Walk On Water Shoe Cost Materials Propulsion $33.92 Styrofoam Styrofoam $9.98 Duct Tape $4.27 Gorrilla Glue $9.99 Shoes Gorrilla Glue Duct Tape Shoes Buoyancy Shape Walking
Materials Used:
$33.92
Retail Price of Product:
Total Profit = $100 - $58.16 = $41.84
Fig, 10. Image of Testing
in the middle of the pool
Table 6. Gantt Chart
Durability | Sustainability Workshop. N.p., 2017. Web. "Height for Age Percentiles 2-18 Years." Height for Age Percentiles 2-18 Years. Developed by the National Center for Health Statistics,
Kasunka, L.G. "CORRELATION BETWEEN STANDING HEIGHT AND ARM SPAN IN YOUNG ADULTS – A CROSS SECTIONAL STUDY." Applied Journal Research (2015): 242-46. Print. "Lightweighting." Lightweighting | Sustainability Workshop. N.p., n.d. Web. Mayer, Caroline E. "Safety Isn't Always Top Priority." The Washington Post. WP Company, 14 July 2001. Web. More, Maria. "The Importance of Product Design and Packaging in Branding." More Than Branding. N.p., 14 Dec. 2010. Web. "Persuasive Design." Persuasive Design | Sustainability Workshop. N.p., n.d. Web. Rieva Lesonsky - November 3, 2015. "What Do Your Customers Care About Most." SCORE. SCORE, 03 Nov. 2015. Web.