
SLIDE 1
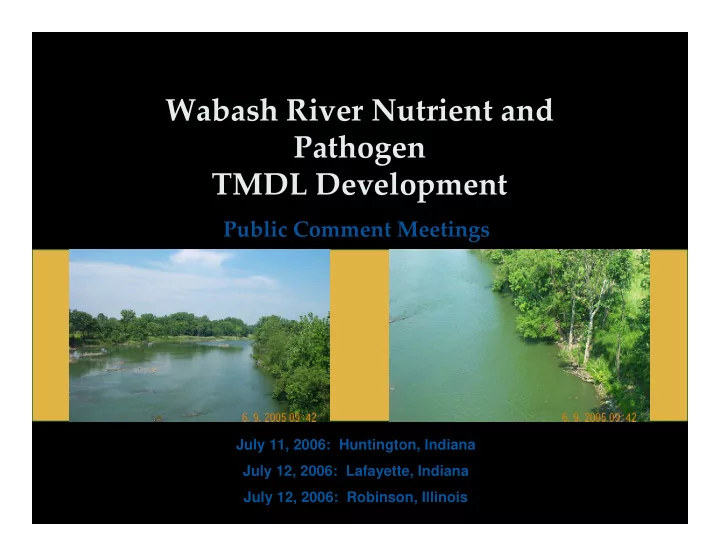
Wabash River Nutrient and Pathogen TMDL Development
July 11, 2006: Huntington, Indiana July 12, 2006: Lafayette, Indiana July 12, 2006: Robinson, Illinois
Wabash River Nutrient and Pathogen TMDL Development Public Comment - - PowerPoint PPT Presentation
Wabash River Nutrient and Pathogen TMDL Development Public Comment Meetings July 11, 2006: Huntington, Indiana July 12, 2006: Lafayette, Indiana July 12, 2006: Robinson, Illinois Agenda Introduction to TMDLs Listing Information
July 11, 2006: Huntington, Indiana July 12, 2006: Lafayette, Indiana July 12, 2006: Robinson, Illinois
Total Coliform Bacteria Escherichia coli Fecal Coliform Bacteria
Water Quality Standards 303(d) List Water Quality Management Plan Water Quality Controls
waters in need of TMDLs
Status
Source BMPs
Suggested E. coli and fecal coliform impairments fairly common Nutrient impairments primarily upstream
River model developed by U.S. Army Corps of Engineers
1) National Pollutant Discharge Elimination System (NPDES) facilities that discharge directly to the Wabash River 2) Subwatersheds draining directly to the Wabash River 3) Significant Wabash River tributaries.
Develop the model data sets (tributary loadings, weather data, point source loadings, etc.)
20000 40000 60000 80000 100000 120000 140000 Feb-98 Feb-99 Feb-00 Feb-01 Feb-02 Date Flow (cfs) 2 4 6 8 10 12 14 Daily Rainfall (in)
Avg Observed Flow (2/1/1998 to 12/31/2002 ) Avg Modeled Flow (Same Period)
Example results: USGS gage 03341500 Wabash River at Terre Haute, Indiana
0.1 0.2 0.3 0.4 0.5 0.6 0.7 0.8 0.9 1 Feb-01 Aug-01 Feb-02 Aug-02 Feb-03 Aug-03 TP (mg/L)
modeled
200 400 600 800 1000 1200 1400 1600 1800 2000 Feb-01 Aug-01 Feb-02 Aug-02 Feb-03 Aug-03 Ecoli (MPN/100mL)
modeled
Example results: IDEM site WLV030-0003 (CR 700 W, Near Lafayette)
NPDES facilities simulated as discharging daily at their design flows and at the maximum of their permit limits CSO loads assumed equal to existing flows and concentrations at water quality standards Full implementation of Ohio Wabash River TMDL
Wabash River Upstream of Vermilion River
0.1 0.2 0.3 0.4 0.5 0.6 Feb-01 May-01 Sep-01 Dec-01 Mar-02 Jun-02 Oct-02 Jan-03 Apr-03
TP(mg/L)
Baseline Conditions Post-TMDL Conditions 1 10 100 1000 10000 Feb-01 May-01 Sep-01 Dec-01 Mar-02 Jun-02 Oct-02 Jan-03 Apr-03
Ecoli(#/100ml)
Baseline Conditions Post-TMDL Conditions Series1
Phosphorus benchmark
Number of days Exceeding Standards Baseline: 72 days/year Post-TMDL 0 days/year Number of days Exceeding Standards Baseline: 50 days/rec season Post-TMDL 0 days/rec season
TMDL = WLA + LA + MOS WLA for “point sources” (regulated under NPDES) LA for nonpoint sources and natural background MOS for Margin of Safety
1)Point source facilities that discharge directly to the Wabash River 2)Subwatersheds draining directly to the Wabash River 3)Significant Wabash River tributaries
Relatively large load reductions needed for tributaries and subwatersheds draining directly to the Wabash River No load reductions needed for point sources (permit limits already in place for larger facilities)
Upper Wabash less than benchmark assuming reductions from Ohio TMDL Lower Wabash already less than benchmark
Relatively minor reductions needed for tributaries and subwatersheds draining directly to the Wabash River Point sources may be significant source of phosphorus, especially during low flow periods Additional monitoring recommended to confirm this finding
Riparian area management Manure collection and storage Nutrient management plans Urban stormwater management practices Septic system management/ education
Additional sampling of WWTP phosphorus loads CSO allocations will be better refined in each city’s Long-Term Control Plan
http: / / www.in.gov/ idem/ programs/ water/ tmdl/ documents.html http: / / www.epa.state.il.us/ water/ tmdl/ report-status.html
Tim Kroeker (317) 234-3312
Linda Schmidt (317) 234-1432
Bonny Elifritz (317) 234-0922
Kathleen Hagan (317) 233-8801
Pamela Brown (317) 234-3406