
Disclaimer: Attention of readers is drawn to important disclaimers printed at the end of this document Analyst Mark Thomas 020 7194 7622
mt@hardmanandco.com
THIS DOCUMENT IS NOT AVAILABLE TO ‘U.S. PERSONS’, NOR TO PARTIES WHO ARE NOT CONSIDERED ‘RELEVANT PERSONS’ IN THE UNITED KINGDOM, NOR SHOULD IT BE TAKEN, TRANSMITTED OR DISTRIBUTED, DIRECTLY OR INDIRECTLY, TO EITHER OF THESE CATEGORIES. SEE PAGE 2 FOR FURTHER DETAILS.
VOLTA FINANCE LIMITED
Manager’s Hardman & Co Forum presentation
Serge Demay, from Fund Manager AXA IM, gave an investor presentation at the Hardman & Co 17 June 2019 Forum (video https://www.hardmanandco.com/june- investor-forum/). We produced a short note for this event, Volta Finance: 9% yield from diversified corporate loan portfolio. In this report, we address the questions that were raised at both the Forum and in the one-on-one discussions our analyst had with attendees post the event. The bias was on credit and how the portfolio may
- ptimise returns if the expected gentle economic deterioration happens.
►
Credit outlook: There were a number of questions on the credit outlook: how and why it may be better to be invested in CLO equity securities than debt if the economy deteriorates; the impact of cov-lite trends; and how Volta has changed from before the financial crisis.
►
Other questions: Other questions included an exploration of the relationship between Volta and its asset manager (we see benefits from this relationship), the level of fees, gearing (and how it is both low and structured to ensure Volta will not be a forced seller of assets), and the impact of sentiment.
►
Valuation: Volta trades at a 16% discount to NAV. Peer-structured finance funds, and a range of other debt funds, on average, trade at smaller discounts. Volta has delivered faster NAV growth than its immediate peers and in-line/lower volatility, making this absolute and relative discount an anomaly.
►
Risks: Credit risk is a key sensitivity (Volta has a widely diversified portfolio). We examined the valuation of assets, highlighting the multiple controls to ensure its validity, in our initiation note last September. NAV is affected by sentiment towards its own and underlying markets. Volta’s long $ position is only partially hedged.
►
Investment summary: Volta is an investment for sophisticated investors, as there could be sentiment-driven, share-price volatility. Long-term returns have been good: ca.10% p.a. returns (dividend reinvested basis) over five years. The current portfolio-expected NAV return is broadly similar. The 2019/20E dividend yield of 9.0% will be covered, in our view, by predictable income streams. Financial summary and valuation (Hardman & Co adjusted basis)
Year-end Jul (€m) 2014 2015 2016 2017 2018 2019E 2020E Coupons & dividend 31.4 33.7 34.7 33.2 38.5 37.0 38.8 Operating income 37.5 46.0 36.5 35.0 37.0 38.5 40.4
- Inv. manager’s fees
- 4.1
- 4.5
- 4.3
- 4.6
- 4.6
- 4.6
- 4.7
- Adj. performance fees
- 2.5
- 3.5
- 1.3
- 1.2
- 1.4
- 1.7
- 1.9
Total expenses
- 7.9
- 10.3
- 7.2
- 7.0
- 0.9
- 0.9
- 0.9
Total comp. income 29.5 35.7 29.3 29.7 30.9 32.4 29.7 Statutory PTP 44.0 47.6 12.6 38.7 22.7 30.8 32.3 Underlying EPS (€) 0.82 0.98 0.80 0.77 0.82 0.85 0.89 NAV 273.6 299.2 289.3 305.5 305.7 314.0 323.8 S/P disc. to NAV 8% 16% 13% 17% 17% 20% 22% Gearing 0% 9% 12% 12% 14% 14% 13% Dividend yield 8.7% 9.0% 9.0% 9.0% 9.0% 9.0% 9.0% Source: Hardman & Co Research
26 July 2019
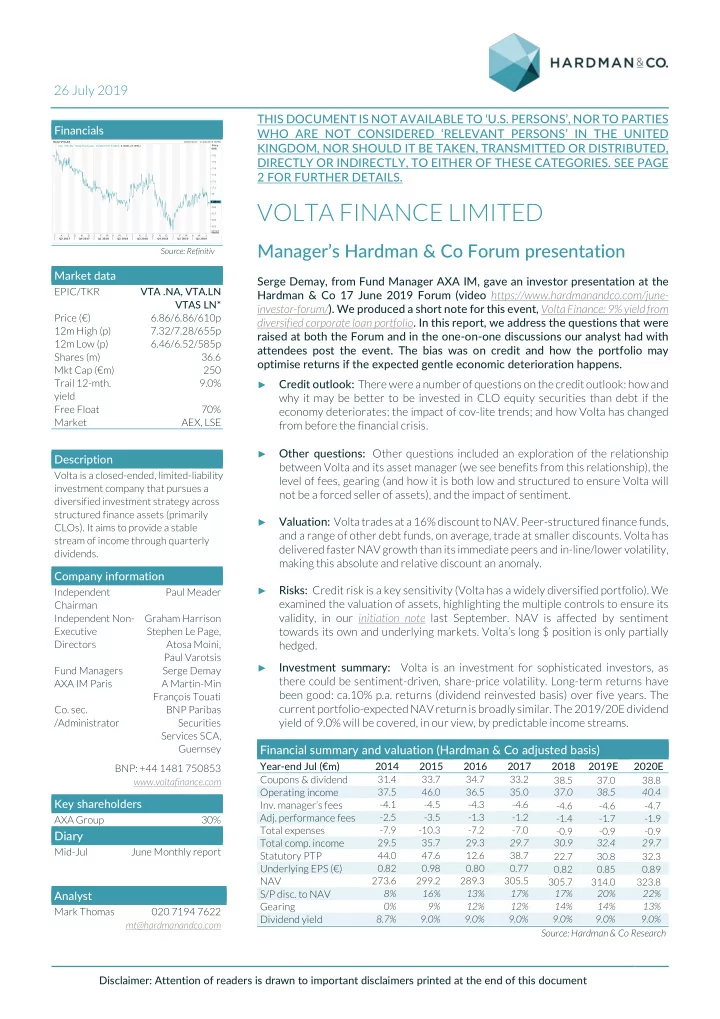
Financials
Source: Refinitiv
Market data
EPIC/TKR VTA .NA, VTA.LN VTAS LN* Price (€) 6.86/6.86/610p 12m High (p) 7.32/7.28/655p 12m Low (p) 6.46/6.52/585p Shares (m) 36.6 Mkt Cap (€m) 250 Trail 12-mth. yield 9.0% Free Float 70% Market AEX, LSE
Description
Volta is a closed-ended, limited-liability investment company that pursues a diversified investment strategy across structured finance assets (primarily CLOs). It aims to provide a stable stream of income through quarterly dividends.
Company information
Independent Chairman Paul Meader Independent Non- Executive Directors Graham Harrison Stephen Le Page, Atosa Moini, Paul Varotsis Fund Managers AXA IM Paris Serge Demay A Martin-Min François Touati
- Co. sec.
/Administrator BNP Paribas Securities Services SCA, Guernsey BNP: +44 1481 750853 www.voltafinance.com
Key shareholders
AXA Group 30%
Diary
Mid-Jul June Monthly report
Daily VTA.AS 26/06/2017 - 21/06/2019 (AMS) Line, VTA.AS, Trade Price(Last), 25/06/2019, 6.8800, 0.0000, (0.00%) Price EUR Auto 6.5 6.6 6.7 6.8 6.9 7 7.1 7.2 7.3 7.4 7.5 7.6 6.8800 J A S O N D J F M A M J J A S O N D J F M A M J Q3 2017 Q4 2017 Q1 2018 Q2 2018 Q3 2018 Q4 2018 Q1 2019 Q2 2019